183 results
Graphing Common Core 8.SP.A.1 resources
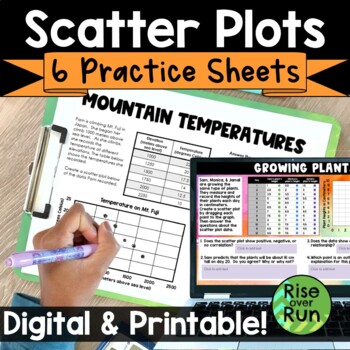
Scatter Plots & Line of Best Fit Practice Worksheets
Practice using scatterplots with these six activities. They can be used as bell ringers, exit tickets, homework, or just general practice. Students graph points, interpret data, and look for types of correlation with these practice sheets. All practice sheets are included as printable PDFs and interactive Google Slides. 6 scatter plot activities are included:Test Grades Scatter Plot PracticeMountain Temperatures Scatter Plot PracticeGrowing Plants Scatter Plot PracticeHair Length Data Collectio
Grades:
8th - 9th
Types:
CCSS:
Also included in: 8th Grade Math Activities & Lessons Bundle for the Whole Year
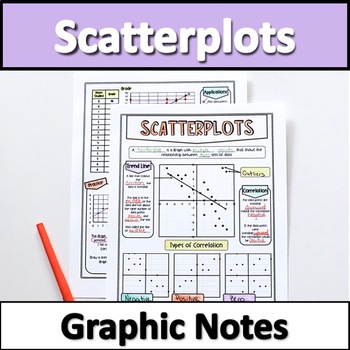
Scatter Plots Graphic Notes
Looking for an engaging way to teach scatter plots? These graphic notes are perfect for student engagement and can double as classroom posters!These content rich, beautiful notes serve as a great introduction to your unit and work wonderfully as a quick-reference for students. Material Covered: trend lines/line of best fit, outliers, types of correlation (positive, negative, zero), creating & interpreting scatter plots and trend lines. This Product Includes1 Page of Key Features Scatter P
Grades:
8th
Types:
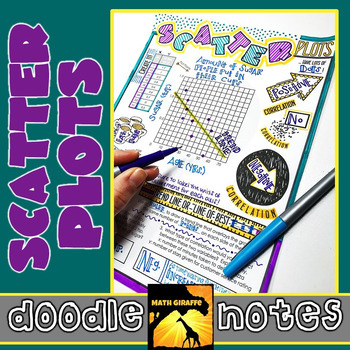
Scatter Plots Doodle Notes
Creating & Analyzing Scatter Plots - Visual Interactive "Doodle Notes"
When students color or doodle in math class, it activates both hemispheres of the brain at the same time. There are proven benefits of this cross-lateral brain activity:
- new learning
- relaxation (less math anxiety)
- visual connections
- better memory & retention of the content!
Students fill in the sheets, answer the questions, and color, doodle or embellish. Then, they can use it as a study guide later on.
C
Subjects:
Grades:
7th - 8th
CCSS:
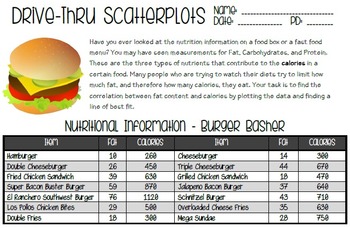
Drivethru Scatter Plots - Line of Best Fit Activity
This activity is a fun way to work with scatter plots in a realistic situation. Students will compare the fat and calories in items from a fictional fast food restaurant by creating a scatter plot. They will also draw a line of best fit, approximate the slope of that line, and make predictions based on the line.
Included:
*Drive-Thru Scatterplots Activity
*Answer Key
Please leave feedback with any suggestions for improvements! :)
Subjects:
Grades:
8th - 9th
Types:
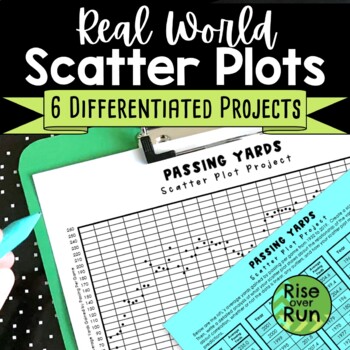
Scatter Plot Project with Real World Sports Data
Practice creating and analyzing scatter plots with these six differentiated real world projects. Students are provided statistics for a sport and must graph the data. Then, they write an analysis describing correlation, whether or not the data is linear, any outliers, and how the scatter plot might be used to make predictions. The scatterplots range from 38 points to 149 points, so they can be used to differentiate. The scatter plots will take a little time to plot, but they result in real
Subjects:
Grades:
8th - 9th
Types:
CCSS:
Also included in: 8th Grade Math Activities & Lessons Bundle for the Whole Year
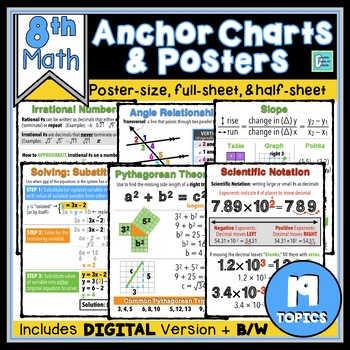
8th Grade Math Anchor Charts | Interactive Notebooks, Posters, Print & Digital
Looking for MATH ANCHOR CHARTS to help your students visualize the major topics in your 8th grade math classroom? Hang these on the wall as POSTERS and give students copies for their INTERACTIVE NOTEBOOKS. We keep anchor charts simple and neat so as not to overwhelm students and help keep them focused on essential information.These are one-page anchor charts for 19 TOPICS that comes in THREE FORMATS including a single page, half sheets (great for interactive notebooks!), and a 2x2 POSTER. The po
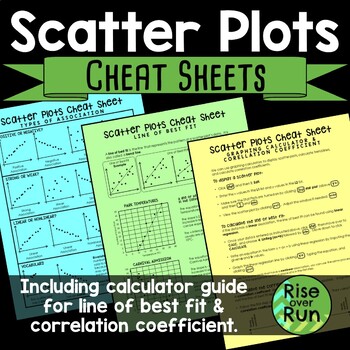
Scatter Plot Cheat Sheets Printable Guided Notes
Detailed sheets for the following topics: •Types of Association & VocabularyThis page shows examples of positive, negative, strong, weak, linear, and nonlinear association. It also shows clusters and outliers.•Line of Best FitThis page explains what a line of best is (or trend line) along with examples and nonexamples. It has 2 real world connections and how to interpret the line of best fit.•Graphing Calculator Guide & Correlation CoefficientThis sheet gives step by step instructions fo
Subjects:
Grades:
8th - 9th
CCSS:
Also included in: 8th Grade Math Activities & Lessons Bundle for the Whole Year
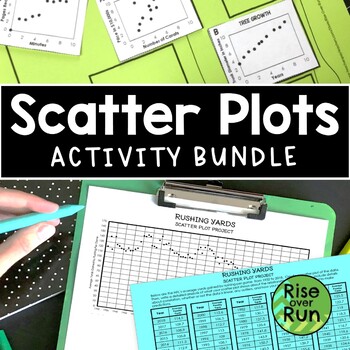
Scatter Plots Bundle of Activities for Algebra 1
Engage students in learning about scatter plots with this bundle of activities! The activities and lessons include real world examples to help students see the relevance and importance of scatter plots!Included:Scatter Plot Experiment ActivityScatter Plot Practice Sheets (Six Worksheets)Math Meets Science TaskCorrelation Coefficient Lesson and Card MatchScatter Plot Projects (Six Topics)Scatter Plots Cheat SheetsScatter Plot Task using a Graphing CalculatorCorrelation vs Causation Info SheetThe
Grades:
8th - 9th
Types:
CCSS:
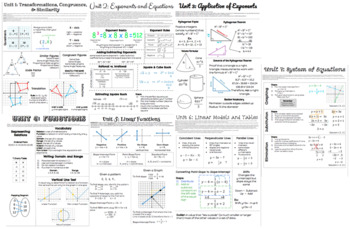
8th Grade Math Cheat Sheets ( Units 1 - 7)
This is a bundle of all condensed cheat sheet for 8th grade math following common core standards. On each unit cheat sheet, the students will be able to see the equations/steps to solve problems found within that unit. Best if printed on card stock. Unit 7 is best if printed in color.
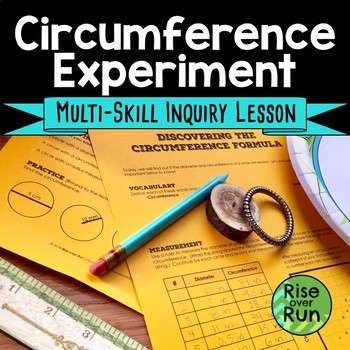
Pi Day Math Activity Circumference Discovery Lesson
In this inquiry lesson, students get to measure circles and discover the relationship between circumference and diameter! They measure circles in the classroom (or that they bring from home), graph a scatterplot, make connections, and discover the formula for a circle's circumference. The two-page handout guides student through the activity. It includes:vocabularymeasuring circles' diameters and circumferences with stringmaking a graphobservationsmaking predictions & improving solutionsp
Grades:
7th - 9th
Also included in: 7th Grade Math Discovery Lessons and Inquiry Activities Bundle
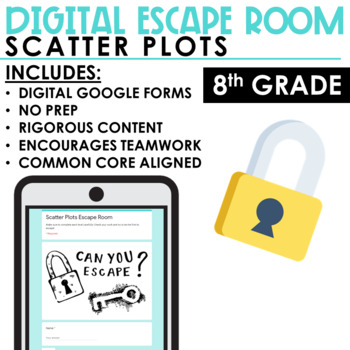
Scatter Plots Escape Room
Do you love using Escape Room activities, but hate the prep? Or are you looking to implement an Escape Room for the first time, but aren’t sure where to start? Then look no further, this resource is low prep, highly engaging, and so easy to implement (even if it’s your first time). This escape includes a tech-free and technology version and requires no lockboxes or elaborate setups! Essentially, students will work through 5 levels of rigorous questions and along the way gather a 5-digit to unloc
Grades:
8th - 9th
Types:
Also included in: Escape Room Math Mega Bundle | Digital and Print
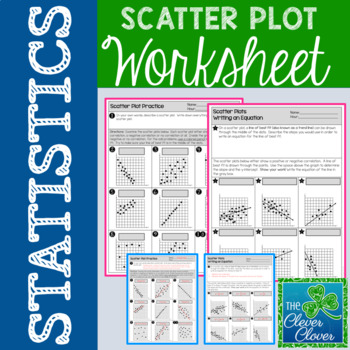
Scatter Plot Worksheet
Scatter Plot Worksheet
This resource allows students to explore scatterplots with a two page worksheet. Students are asked to define scatterplots in their own words. Nine questions ask students to identify the type of correlation (positive, negative or no correlation) that exists between two variables. Students are also asked to describe the steps used to write an equation for the line of best fit. Six additional questions require students to calculate the slope and determine the y-intercept
Subjects:
Grades:
6th - 9th, Adult Education
Types:
CCSS:
Also included in: Scatter Plot Mini-Bundle
Scatter Plots Print and Digital Stations
These stations make great practice or review for scatter plot concepts, including determining correlation, describing relationships in bivariate data, identifying appropriate trend lines, constructing scatter plots, writing an equation for a line of fit, making predictions, and stating the meaning of the x- and y-intercept and the rate of change. Students practice by working collaboratively in groups and moving around the classroom where they find a new set of practice problems at each table. S
Grades:
7th - 9th
Types:
Also included in: 8th Grade Math Curriculum Mega Bundle
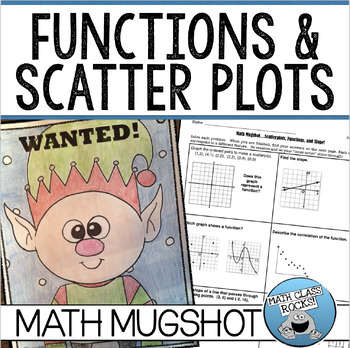
SCATTERPLOTS, FUNCTIONS, AND SLOPE ACTIVITY
Student of ALL ages love to draw and color... especially in Math Class! MATH MUGSHOTS are a GREAT way to review math concepts while providing some “color” to math class. You can use this activity to review for a test, as a homework assignment, as extra credit, or as an assessment.Looking for more Mugshots??Click HERE to purchase the MUGSHOT BUNDLE and SAVE $$!Click HERE to create your own CUSTOM MUGSHOT BUNDLE!Mathematical Concepts in THIS activity:Determine if a graph shows a function.Determin
Grades:
7th - 8th
Types:
Also included in: MATH MUGSHOTS BUNDLE (SET 3)
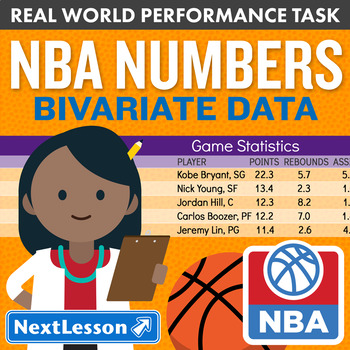
Bundle G8 Bivariate Data / Scatterplots - NBA Numbers Performance Task
Bundle of 29 editions of NBA Numbers Performance Task for 8th grade
In the NBA Numbers Performance Task, students use real data on the players in their favorite basketball team to practice interpreting a scatter plot and finding the equation for the line of best fit, and to extend into constructing a scatter plot from a set of data in an engaging, real world context. Students take on the role of a statistical analyst for the team and determine which player statistics are related to help make im
Subjects:
Grades:
8th
Types:
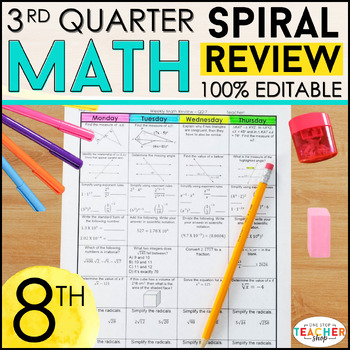
8th Grade Math Review & Quizzes | Homework or Warm Ups | 3rd QUARTER
This 8th Grade math spiral review resource can easily be used as math HOMEWORK, WARM UPS, or a DAILY MATH REVIEW! This resource was designed to keep math concepts fresh all year and to help you easily track student progress. All pages are 100% EDITABLE and easy to differentiate to fit your students' needs.Get the ENTIRE YEAR BUNDLE! {CLICK HERE} ☝☝ Check out the Preview for more details and 3 FREE Weeks! ☝☝This Spiral Review System is also available for LANGUAGE (Grammar & Word Study)Go 100%
Subjects:
Grades:
8th
Types:
End of Year Math Review 8th Grade Booklet
This End of Year Math Review is intended to help students understand how to answer assessment questions based on the eighth grade Common Core State Standards. Students also review key vocabulary words and assess their understanding of all eighth grade Common Core State Benchmarks. End of Year Math Review Features: 60 CCSS Math Review Questions Teacher facilitated activity for 60-90 minutes of classroom time or Independent Activity for Students as Bellwork, Classwork, or Homework to review
Subjects:
Grades:
8th
Types:

Bundle G8 Bivariate Data & Scatter Plots-‘Relationship Status’ Performance Task
Bundle of 10 editions of Relationship Status Performance Task for 8th grade
In the Relationship Status Performance Task, students use real bivariate data from the thrill features of a roller coaster to practice constructing and interpreting scatter plots and to extend into drawing and interpreting a line of best fit in an engaging, real world context. Students take on the role of an engineer and use the data to discover the relationships between design features such as speed, ride duration, hei
Subjects:
Grades:
8th
Types:
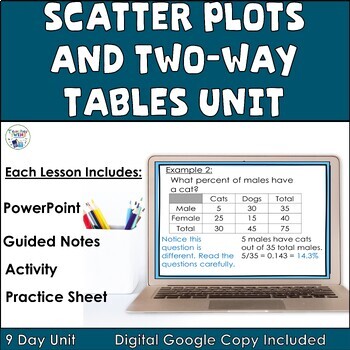
Scatter Plots and Two-Way Tables 8th Grade Math Lessons Unit
Make lesson planning easy with this no prep Scatter Plots and Two-Way Tables Unit! Included are 9 ready-made lessons to teach scatter plots and two-way tables to your students. This Scatter Plots and Two-Way Tables Unit is very easy to use and will save you a lot of time!Teach your students scatter plots and two-way tables by using our editable PowerPoints with guided notes. Students will love learning about scatter plots and two-way tables when you use the included activities for each lesson! T
Grades:
8th - 9th
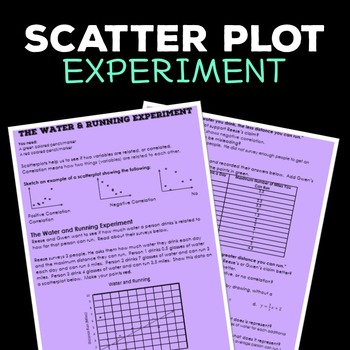
Scatter Plot Intro Activity Worksheet
Students create a scatterplot based on data from an experiment and answer questions related to their graph. This activity can be completed as a whole class with guidance to introduce scatter plots and the vocabulary. Or, it may be used as independent practice if students are familiar with scatter plots. The student activity is 2 pages in PDF format. An answer key is included, along with extension questions. This activity can lead to great discussions about misleading graphs and the differen
Subjects:
Grades:
8th - 9th
Also included in: 8th Grade Math Activities & Lessons Bundle for the Whole Year
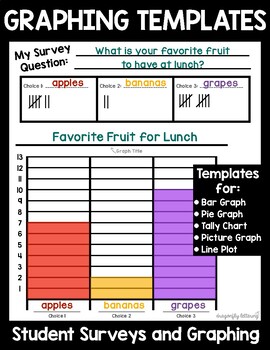
Graphs & Survey Templates - Conduct a Survey, Create Graphs, Analyze Data
Graphing and Survey TemplatesAligns with K-5 CCSS for Measurement and DataThese worksheets can be used YEAR ROUND! Students love giving surveys and gathering information from their classmates. Graphing and analyzing data is an important skill that develops across grade levels.This file includes:2 Introductory Bar Graph Surveys4 Bar Graph TemplatesA blank template to use for Line Plots, Picture Graphs, Bar Graphs, etc.4 Tally Graph Templates1 Pie Chart TemplateGraphing QuestionsEach graphing temp
Grades:
K - 8th
Types:
Pre-Algebra - Curriculum - BUNDLE for Google Slides™
- Great for online and distance learning! Created to be compatible with Google Slides™!-In this interactive curriculum, students will test their skills and application comprehension with all topics of Pre-Algebra! This curriculum is no prep, paperless, easy to grade, and fun interactive experience!- Includes all 7 of the units below with 68 different activities and over 1,500 problems! Purchase it once and you'll always be able to re-download when there are new additions.The Number System - Unit
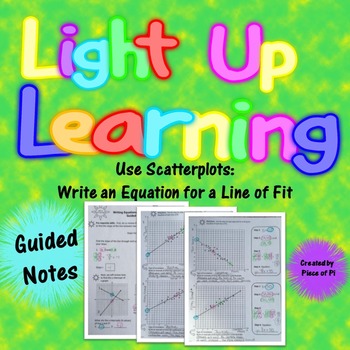
Line of Fit Scatterplot Guided Notes Bivariate Data 8.SP
Line of Fit: Write the Equation. Use Bivariate Data and Explore Scatterplot Correlation. Color Coded Guided Notes. Also includes review of Slope, y-Intercepts, and Scatterplot Correlation.
Color Coded guided notes keeps students engaged!
Light up their learning! This technique has worked beautifully with my special-education students, and gets them comfortable using new concepts. When completed, these pages make great study guides. Also a useful addition to interactive math notebooks!
Produ
Subjects:
Grades:
7th - 9th
Types:
Also included in: 8th Grade Math Review Activities Notes Mega Bundle
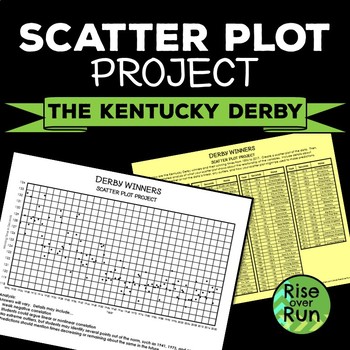
Scatterplot Project with Real World Stats from the Kentucky Derby
Practice creating and analyzing scatter plots with this project. Students are provided statistics for winning horses and must graph the data. Then, they write an analysis describing correlation, whether or not the data is linear, any outliers, and how the scatter plot might be used to make predictions. This is one of the projects in my Differentiated Scatter Plot Projects!Thank you for your interest in this resource from Rise over Run. Related Resources:Scatter Plot Practice WorksheetsScatter
Grades:
8th - 9th
Types:
CCSS:
Also included in: Algebra I Sub Plans Bundle with Activities
Showing 1-24 of 183 results


