7 results
Statistics graphic organizer interactive whiteboards
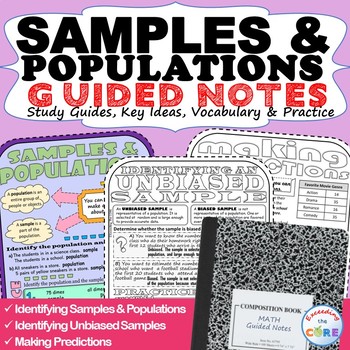
SAMPLES & POPULATIONS Doodle Math - Interactive Notebooks (Guided Notes)
- Great for online learning and distance learning!Have your students use these SAMPLES & POPULATIONS Guided Notes to review key ideas and essential vocabulary . Guided Notes aid in student focus, concept retention, engagement and creativity. Using this resource will allow students to synthesize this math concept and create their own tangible connections in their notes. Guided Notes Includes:__ Key Ideas with Verbal & Numerical Examples__ Essential Vocabulary with Definitions__ Skills Pr
Subjects:
Grades:
6th - 8th
Also included in: 7th GRADE MATH Assessments, Warm-Ups, Task Cards, Worksheets BUNDLE
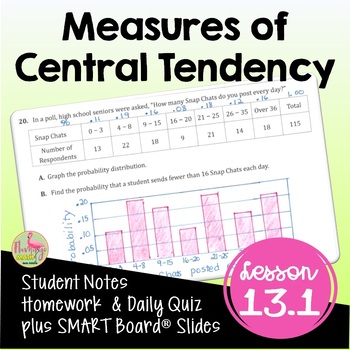
Measures of Central Tendency (Algebra 2 - Unit 13)
Measures of Central Tendency Algebra 2 Lesson:Your Pre-AP Algebra 2 Honors students will draw, analyze and interpret box-and-whisker plots, find outliers, and calculate measures of central tendency in this unit 13 lesson on Data Analysis & Statistics that cover the concepts in depth. #distancelearningtptWhat is included in this resource?⭐ Guided Student Notes⭐ Google Slides®⭐ Fully-editable SMART Board® Slides⭐ Homework/Practice assignment⭐ Lesson Warm-Up (or exit ticket)⭐Daily Content Quiz
Subjects:
Grades:
8th - 11th, Higher Education
CCSS:
Also included in: Algebra 2 Curriculum Mega Bundle | Flamingo Math
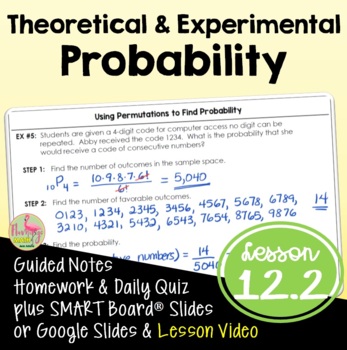
Theoretical and Experimental Probability (Algebra 2 - Unit 12)
Theoretical & Experimental Probability Algebra 2 Lesson:Your Pre-AP Algebra 2 Honors students will find both experimental and theoretical probabilities in this Unit 12 lesson. #distancelearningtptWhat is included in this resource?⭐ Guided Student Notes⭐ Google Slides®⭐ Fully-editable SMART Board® Slides⭐ Homework/Practice assignment⭐ Lesson Warm-Up (or exit ticket)⭐ Daily Content Quiz (homework check)⭐ Video Lesson Link for Distance Learning - Flipped Classroom models⭐ Full solution setStude
Subjects:
Grades:
8th - 11th, Higher Education
CCSS:
Also included in: Algebra 2 Curriculum Mega Bundle | Flamingo Math
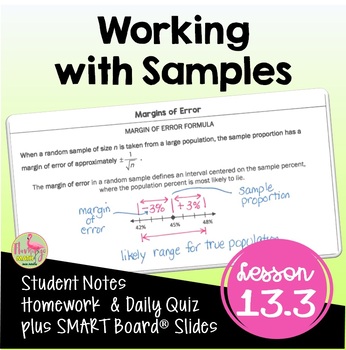
Working with Samples (Algebra 2 - Unit 13)
Working with Samples Algebra 2 Lesson:Your Pre-AP Algebra 2 Honors students will find draw, analyze and interpret box-and-whisker plots, find outliers, and calculate measures of central tendency in this unit 13 lesson on Data Analysis & Statistics that cover the concepts in depth. #distancelearningtptWhat is included in this resource?⭐ Guided Student Notes⭐ Google Slides®⭐ Fully-editable SMART Board® Slides⭐ Homework/Practice assignment⭐ Lesson Warm-Up (or exit ticket)⭐Daily Content Quiz (ho
Subjects:
Grades:
8th - 11th, Higher Education
CCSS:
Also included in: Algebra 2 Curriculum Mega Bundle | Flamingo Math
Box and Whisker Plots Smartboard Slides Lesson St. Patrick's Day Theme
This Box and Whisker Plots Smartboard Lesson teaches students how to create a Box Plot step by step. LOTS of practice in creating and reading Box and Whisker Plots, along with an Interactive QUIZ on Box Plots. These slides have a St. Patrick's Day clipart theme. In case you don't want that, I also have the SAME Box and Whisker Plots Smartboard Lesson on everyday math slides as well. https://www.teacherspayteachers.com/Product/Box-and-Whisker-Plots-Smartboard-Lesson-Step-by-Step-How-to-Constuct-
Subjects:
Grades:
5th - 7th

MEAN MEDIAN MODE (Lesson 1)
LOOK NO FURTHER, YOUR COMMON CORE HIGHLY EFFECTIVE ALIGNED LESSON IS HERE. NOT JUST AN ACTIVITY! REAL LIFE CAPTIVATING SCENARIOS.
-DOK QUESTIONING
-DIFFERENTIATION
-RUBRIC BASED ACTIVITY
-LITERACY VENTURE
-ASSESSMENT
In this bundle you will receive:
- Smart Notebook Slides
- Pamphlet
- Rubric Based Activity Task Card
- Teacher Manual
This lesson provides a range of questioning techniques meeting the criteria of the Common Core Standards. Aligned with these standards you will be provided with
Subjects:
Grades:
6th - 9th
SID.4 Calculating the Area Under the Normal Curve.
This lesson teaches students how to use the mean and standard deviation of a data set to create a normal curve and how to calulate the area (population percentage) under the normal curve given a range of values.
This lesson includes a SMART Notebook Presentation, guided notes with class work problems, and an answer key. The guided notes correspond with the SMART Notebook Presentation.
Subjects:
Grades:
9th - 12th
CCSS:
Showing 1-7 of 7 results


