128 results
Graphing assessments on sale
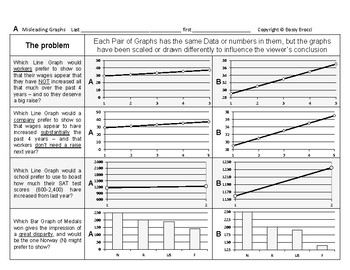
Stats&Data 14: Misleading & Misinterpreting Data Graphs Charts Statistics
This is an excerpt from my popular line ofBossy Brocci Math & Big Science workbooks on Amazon.ANSWER KEY included=======================Students will:1) Analyze 20 different Graphs or Data Displays2) Draw Conclusions & Answer questions about theaccuracy, fairness, limitations & legitimacy of those Graphs3) Answer 16 Multiple-choice questionsbased on their Calculations & Observations4) Be compelled to show their work in a neat & orderly format5) Be trained to methodically &
Subjects:
Grades:
Not Grade Specific
Types:
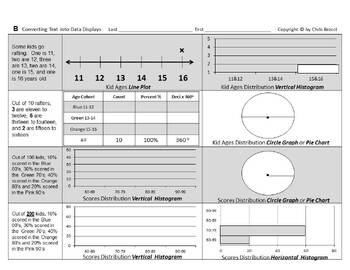
Stats&Data Bundle C: Data Displays Measures of Central Tendency & Variation
From the Author of Bossy BrocciMath & Big Science workbooks on Amazon,this Bundle of Data Displays,Measures of Central Tendency(Mean, Median, Mode & Range);and Measures of Variation(Quartiles, Interquartile Range, Outliers & Box Whisker plots)contains:11 Lessons32 Worksheets832 Problems & Tasks- and Assessment up the a$$=======================Answer KEYS included=======================Coverage Specifics:#1 Identify & Select Common Typesof Data DisplaysStudents will:1) Identi
Subjects:
Grades:
Not Grade Specific
Types:
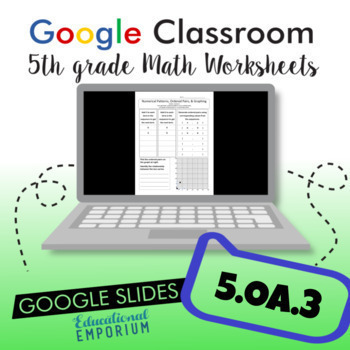
Numerical Patterns & Graphing Worksheet Google Classroom™ ⭐ 5.OA.3
5.OA.3 Worksheet for 5th Grade Math Google Slides:This worksheet is aligned with Common Core Standard 5.OA.3: Numerical Patterns, Ordered Pairs, & Graphing. Designed to make the classroom efficient and interactive, the worksheet is presented as Google Slides, eliminating paper and planning.5.OA.3: Generate two numerical patterns using two given rules. Identify apparent relationships between corresponding terms. Form ordered pairs consisting of corresponding terms from the two patterns, and g
Grades:
4th - 6th
Types:
CCSS:
Florida BEST 3rd Grade Math: GR (Geometric Reasoning) Progress Monitoring Prep
Florida's new B.E.S.T. math standards are here for 2022-2023 and forward! This packet focuses on the new GR domain (Geometric Reasoning) by providing 15 worksheets to prepare and review for Progress Monitoring. Great for in-class review, homework, math centers, and end-of-year progress monitoring prep / test prep. The entire 3rd grade review of all 34 standards is available here.The standards included in this packet are as follows:MA.3.GR.1.1 - 2 worksheetsMA.3.GR.1.2 - 2 worksheetsMA.3.GR.1.
Grades:
3rd
Types:
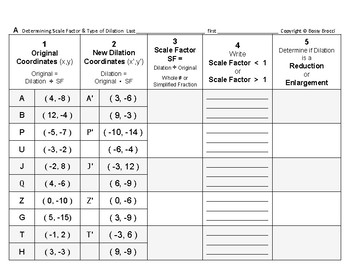
Transformations 16: Dilations - Calculate Scale Factors & Write Type of Dilation
This is an excerpt from my popular line ofBossy Brocci Math & Big Science workbooks on Amazon.Answer KEY included=======================Students will:1) Calculate and Write 10 Missing Scale Factorsfrom NON-graphical (i.e. just numerical) Original and Dilation Coordinates2) Convert Scale Factors to eitherWhole Numbers or Simplified Fractions3) Determine and Write whether‘Scale Factor is < 1’ or ‘Scale Factor is > 1’4) Determine and Write if the Dilation is a‘Reduction’ or ‘Enlargement’5
Subjects:
Grades:
Not Grade Specific
Types:
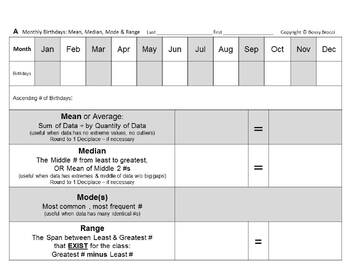
Stats&Data Bundle B: Birthdays Data Displays Variation Mean Median Mode Range
From the Author of Bossy BrocciMath & Big Science workbooks on Amazon,this Birthdays Stats (Mean, Median, Mode, Range),Measures of Variation & Data Displays Bundlecontains:2 Lessons12 Worksheets294 Problems & Tasks- and Assessment up the a$$=======================Answer KEY included=======================Coverage Specifics:#1 Author's Numbers Birthdays ProjectStudents will:1) Convert the given Monthly Birthdaysfrom Mr. Brocci's School numbers into:Ascending List/Data SetMeanMedianMod
Subjects:
Grades:
Not Grade Specific
Types:
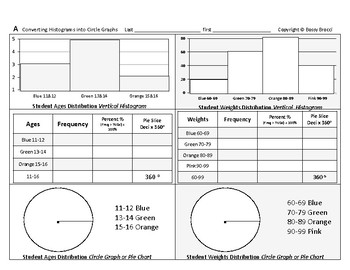
Stats&Data 03: Convert Histograms into Circle Graphs Construct Create Pie Charts
This is an excerpt from my popular line ofBossy Brocci Math & Big Science workbooks on Amazon.Answer KEY included=======================Students will:1) Convert 3 Vertical Histograms into3 Data Tablesand3 Colored or Shaded Circle Graphs (Pie Charts)2) Convert 1 Horizontal Histogram into1 Data Tableand1 Colored or Shaded Circle Graph (Pie Chart)3) Be compelled to show their work in a neat & orderly format4) Be trained to methodically & systematicallyPresent Data in different DisplaysN
Subjects:
Grades:
Not Grade Specific
Types:
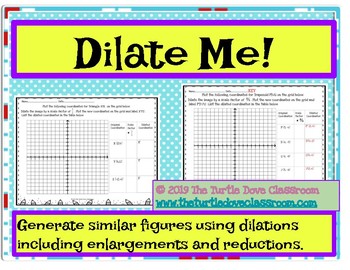
Middle School Math Center: Similar figures using dilations on a graph and table
Your students will practice hands on graphing with 4 different figures, rectangle, triangle, pentagon, trapezoid, plus a fill in the blank graph so you are able to make your own figure. I have also included a fill in the blank graph and table so you are able to use it as a assessment or exit ticket for your class. you may also use the fill in the blank graph for guided notes or whole class examples. Answer key is included. Visit my blog for more math stations ideas. www.theturtledoveclassro
Grades:
7th - 10th
Types:
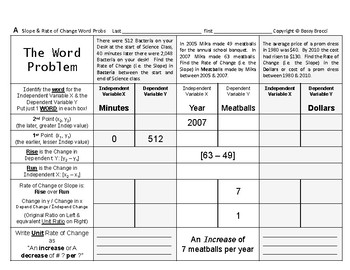
Pre-Graphing 17: Calculate Slope as a Rate of Change from Word Problems
This is an excerpt from my popular line ofBossy Brocci Math & Big Science workbooks on Amazon.====================Students will:1) Solve 6 Rate of Change or Slope Word Problems by identifying & Writing the Independent and Dependent-Variable Data pairs or Points, and Solving for Rate of Change using the 2-Point Slope Formula2) Write the Unit Rate of Change as a Complete Sentence 3) Be compelled to show their work in a neat & orderly format4) Be trained to solve Rate of Change Word Pro
Subjects:
Grades:
Not Grade Specific
Types:
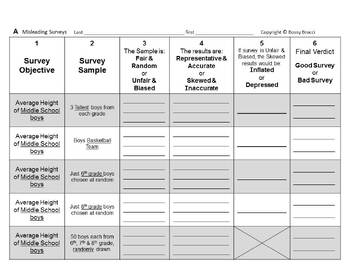
Stats&Data Bundle D: Misleading Misinterpreting Surveys Statistics Graphs Charts
From the Author of Bossy BrocciMath & Big Science workbooks on Amazon,this Bundle onMisleading & MisinterpretingSurveys, Statistics, and Graphs/Chartscontains:2 Lessons8 Worksheets78 Problems & Tasks- and Assessment up the a$$=======================Answer KEYS included=======================Coverage Specifics:#1 Misleading & Misinterpreting Surveys & Statistics+ QUIZStudents will:1) Read 10 different Surveys and Survey Samples2) Determine and Write if those Surveys are:Fair
Subjects:
Grades:
Not Grade Specific
Types:
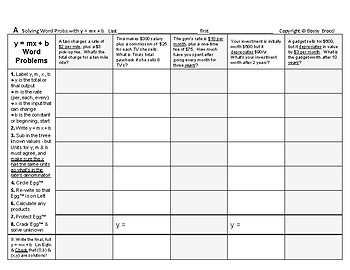
Graphing Linear Equations 11: Use Slope Intercept y = mx + b Solve Word Problems
This is an excerpt from my popular line ofBossy Brocci Math & Big Science workbooks on Amazon.====================Students will:1) Write 20 Slope-Intercept linear equationsfrom 20 Word Problems2) Solve for y 5 times, m 5 times,x 5 times & b 5 times3) Be compelled to show their work in a neat & orderly format4) Use the Bossy Brocci "Egg" method for solving algebraic equations5) Be compelled to show their work in a neat & orderly format6) Be trained to solve algebraic equations met
Grades:
Not Grade Specific
Types:
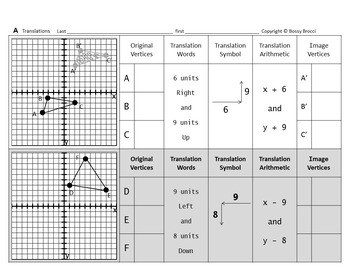
Transformations MEGA Bundle E: Translations Reflections Rotations Dilations
Spun-off from my popular series of Bossy Brocci Math & Big Science Workbooks on Amazon,this Transformations MEGA Bundle onTranslations, Reflections, Rotations & Dilationscontains:5 Units22 Lessons81 Worksheets1,118 Problems & Tasks- and Assessment up the a$$=======================This Transformations MEGA Bundle containsALL 4 Sub-bundles A, B, C & D within it:A Translations BundleB Reflections BundleC Rotations BundleD Dilations Bundleplusthe Summary of Transformation Properti
Grades:
Not Grade Specific
Types:
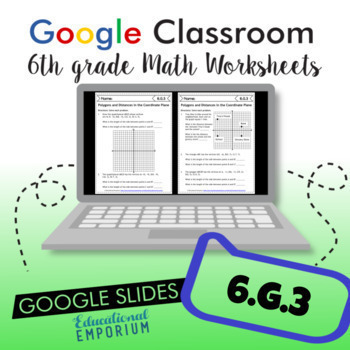
6.G.3 Digital Worksheets ⭐ Coordinate Plane Polygons and Distances 6th Grade
6.G.3 Worksheets for 6th Grade Math Google Slides:These worksheets are aligned with Common Core Standard 6.G.3: Draw Polygons in the Coordinate Plane Given Coordinates for the Vertices; Use Coordinates to Find the Length of a Side. Designed to make the classroom efficient and interactive, the worksheets are presented as Google Slides, eliminating paper and planning.6.G.3. Draw polygons in the coordinate plane given coordinates for the vertices; use coordinates to find the length of a side joinin
Subjects:
Grades:
5th - 7th
Types:
CCSS:
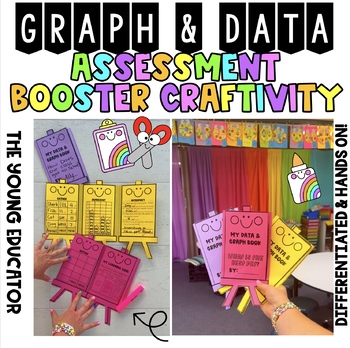
GRAPH & DATA - ASSESSMENT BOOSTER CRAFTIVITY
Assess your students' Positional Knowledge and Skills with my GRAPH & DATA - ASSESSMENT BOOSTER CRAFTIVITY!This activity makes the perfect Formative, Summative or Portfolio Assessment Piece!Included in this pack:♡ 5 different Graph & Data Craftivity pages - Gather, Represent & Interpret Data!♡ Differentiated Questions to support all your learners!♡ A range of Differentiated steps from simple Gathering & Interpreting to more complex, real world connections☆ Differentiated Learning
Subjects:
Grades:
1st - 3rd
Florida BEST 2nd Grade Math: GR (Geometric Reasoning) Progress Monitoring Prep
Florida's new B.E.S.T. math standards are here for 2022-2023 and forward! This packet focuses on the new GR domain (Geometric Reasoning) by providing 8 worksheets to prepare and review for Progress Monitoring. Great for in-class review, homework, math centers, and end-of-year progress monitoring prep / test prep. The entire 2nd grade review of all 27 standards is available here.The standards included in this packet are as follows:MA.2.GR.1.1 - 2 worksheetsMA.2.GR.1.2 - 1 worksheetMA.2.GR.1.3
Grades:
2nd
Types:
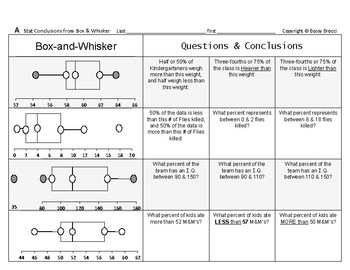
Stats&Data 09: Draw Statistical Conclusions from Box and Whisker Box Plots QUIZ
This is an excerpt from my popular line ofBossy Brocci Math & Big Science workbooks on Amazon.Answer KEY included=======================Students will:1) Analyze 8 Box & Whisker Plots (Box Plots)2) Answer at total of 24 questionsfrom those Plots regarding variousFraction & Percent Distribution portions3) Be compelled to show their work in a neat & orderly format4) Be trained to methodically & systematicallyTranslate or Convert Box & Whisker Plotsinto Fractions & Percen
Subjects:
Grades:
Not Grade Specific
Types:
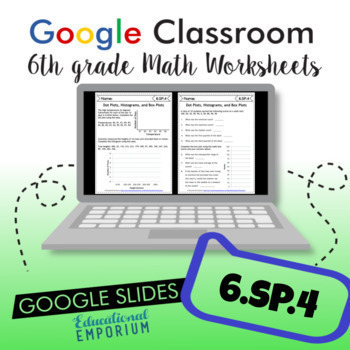
6.SP.4 Digital Worksheets ⭐ Numerical Data on Number Lines, Plots & Histograms
6.SP.4 Worksheets for 3rd Grade Math Google Slides:These worksheets are aligned with Common Core Standard 6.SP.4: Display Numerical Data. Designed to make the classroom efficient and interactive, the worksheets are presented as Google Slides, eliminating paper and planning.6.SP.4: Display numerical data in plots on a number line, including dot plots, histograms, and box plots.These two Google Slides worksheets are perfect for laptops, iPads, Chromebooks, and tablets of all brands and operating s
Grades:
5th - 7th
Types:
CCSS:
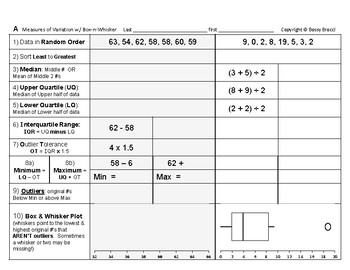
Stats&Data 06: Variation Quartiles Interquartile Range Outliers Box Whisker Plot
This is an excerpt from my popular line ofBossy Brocci Math & Big Science workbooks on Amazon.Answer KEY included=======================Students will:1) Sort or Sequence 8 different Data Sets or Sets of Numbers2) Calculate & Identify for each of the 8 Data Sets the:MedianUpper QuartileLower QuartileInterquartile RangeOutlier ToleranceAllowed MinimumAllowed Maximumandany Outliers3) Draw or Construct the Box and Whisker Plots (Box Plots)directly beneath their calculations4) Be compelled to
Subjects:
Grades:
Not Grade Specific
Types:
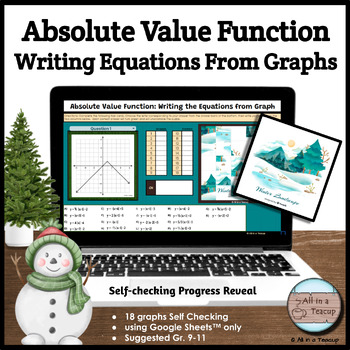
Absolute Value Function Writing Equation from Graph Winter Activity
This writing equations from Absolute Value Function Graphs Winter Unscramble the Puzzle Activity an engaging way to review during the Winter Season. This is a no-prep ready-to-go digital activity! This is a self checking one that’ll be revealing a Winter Forest Watercolor puzzle picture!There are 18 self checking Task Cards to work with. The students will find their answers in the answer bank provided. When writing the correct answer, the box turns green and starts progressively unscrambling th
Subjects:
Grades:
9th - 11th
Types:
Florida BEST 5th Grade Math: GR (Geometric Reasoning) Progress Monitoring Prep
Florida's new B.E.S.T. math standards are here for 2022-2023 and forward! This packet focuses on the new GR domain (Geometric Reasoning) by providing 15 worksheets to prepare and review for Progress Monitoring. Great for in-class review, homework, math centers, and end-of-year progress monitoring prep / test prep. The entire 5th grade review of all 36 standards is available here.The standards included in this packet are as follows:MA.5.GR.1.1 - 2 worksheetsMA.5.GR.1.2 - 1 worksheetMA.5.GR.2.1
Grades:
5th
Types:
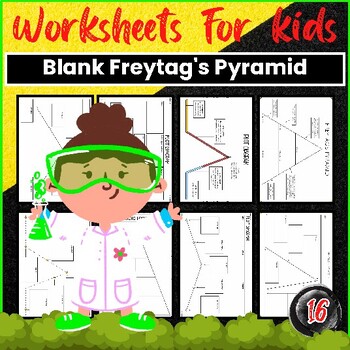
Blank Freytag's Pyramid Worksheets activities
Freytag's Pyramid is a well-known literary tool that helps analyze the structure of a story. If you are an English teacher, writer, parent, student, or simply someone who is looking for a strategy to understand storytelling elements, our Blank Freytag's Pyramid Worksheets are the perfect resource. Table : Freytag Pyramid Worksheet Freytag Plot Pyramid Graphic Organizer Freytags Pyramid Graphic Organizer Freytags Pyramid Plot Structure Freytags Pyramid Freytag Pyramid of Dramati
Subjects:
Grades:
6th - 12th
Types:
Spatial Sense Strand Assessment Package - Grade 6
Grade 6 Math Assessments - E. Spatial Sense StrandUpdated Curriculum Assessments Included: E1.2Construct three-dimensional objects when given their top, front, and side views.E1.3 & E1.4Plot and read coordinates in all four quadrants of a Cartesian plane, and describe the translations that move a point from one coordinate to another &Describe and perform combinations of translations, reflections, and rotations up to 360° on a grid, and predict the results of these transformations. E2.2
Grades:
6th
Types:
Also included in: Grade 6 Math Assessment Bundle- Full Year
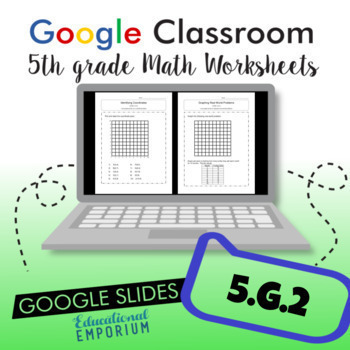
5.G.2 Worksheets for Google Classroom™ ⭐ Graphing Real World Problems
Graphing Real World Problems Worksheet for 5th Grade Math Google Slides: These worksheets are aligned with Common Core Standard 5.G.2: Graphing Real World Problems. Designed to make the classroom efficient and interactive, the worksheets are presented as Google Slides, eliminating paper and planning.5.G.2. Represent real world and mathematical problems by graphing points in the first quadrant of the coordinate plane, and interpret coordinate values of points in the context of the situation.These
Grades:
4th - 6th
Types:
CCSS:
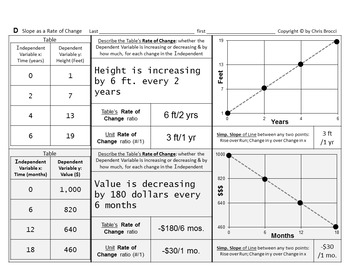
Graphing Bundle E: Calculating Graphing SLOPE as a RATE of CHANGE bundle
Welcome to my biggest-selling Math Bundle!==============================Spun-off from my popular series ofBossy Brocci Math & Big Science Workbooks on Amazon,this Bundle on Slope as a Rate of Change contains:7 Lessons22 Worksheets232 problems- and Assessment up the a$$!===========================With this bundle, your students will master Slope as a Rate of Change- forwards and backwards, inside and out.An extremely THOROUGH treatment of Slope as a Rate of Change,this Bundle might be the cl
Grades:
Not Grade Specific
Types:
Showing 1-24 of 128 results


