22 results
Free high school statistics resources for Microsoft Excel
Guided Notes Data Supplement - Lesson 3.4
IB Applications & Interpretations:
Subjects:
Grades:
10th - 12th
Types:
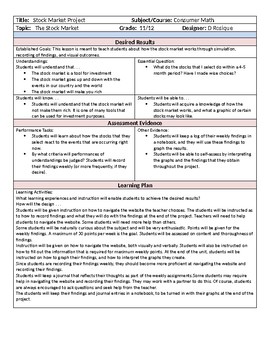
Stock Market Project plus Graphing and Data Recording
This is a project that I use in my classroom to teach students how the stock market works and what the data looks like after a period of at least three months. Students record data findings weekly, and after a period of at least twelve weeks, the graph their findings. This is useful in illustrating how the stock market goes up and down with the events that are happening throughout the world.
Subjects:
Grades:
11th - 12th
Types:
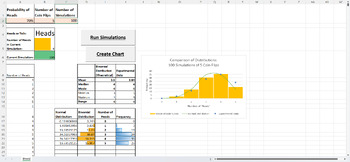
Excel Probability/Statistics Task - Biased Coin Simulator
Allow students to explore probability distributions and statistical sampling in real-time with this Biased Coin Simulator Task. Students will also develop strong ICT skills as they get the opportunity to create and test their own copy of this simulator in a Microsoft Excel Macro-Enabled Workbook.The SimulatorIn the Biased Coin Simulator the probability of the coin landing on heads can be adjusted to any value between 0 and 1. The Bernoulli trial of flipping the coin is repeated (the simulator ca
Grades:
9th - 12th
Types:

Overview of Mr. Bill's Store
I learned many years ago that the most effective way of keeping math engaging for students is through SELECTIVE PROBLEM SOLVING. All kinds of problem solving...not just traditional "solve this equation" problems. I will offer teachers ideas for keeping kids excited about math. Such as...building a probability distribution of outcomes from throwing dice...constructing a pendulum that will draw Lissajous figures...constructing a Foucault pendulum...how to do interesting large-scale astronomical
Subjects:
Grades:
5th - 12th
Types:
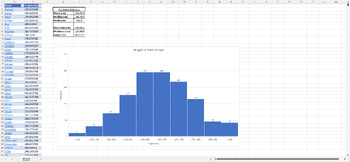
Histograms and Summary Statistics in Excel
Embark on a journey through data analysis with our hands-on task, tailored specifically for Microsoft Excel. Utilising a compelling dataset on the heights of 1,000 individuals, educators can guide students through the intricacies of summary statistics and the visual appeal of histograms.SummaryThe Excel spreadsheet contains a list of 1000 names with a random height generated for each name. Students will use Microsoft Excel to:Find the mean, median, mode, and range of the datasetGenerate a histog
Grades:
8th - 10th
Types:
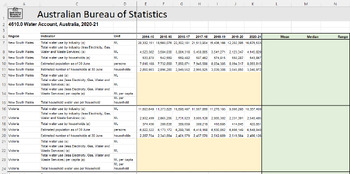
Excel Statistics Task - Australian Water Consumption
Dive deep into the waters of data analysis with this engaging Microsoft Excel activity focused on Australian water consumption! Sourced from the Australian Bureau of Statistics, students will navigate through real-world datasets from 2014-15 to 2020-21, equipping them with skills that extend beyond the classroom. What's Included:Interactive Spreadsheet: An authentic spreadsheet titled "Water Account, Australia (2020-21)" filled with key indicators for water consumption and use.Guided Instruction
Grades:
7th - 12th
Types:
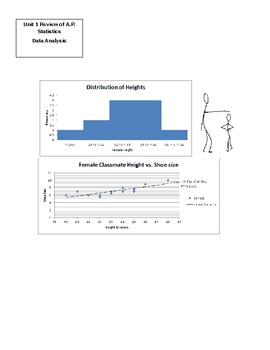
Data Analysis Review Project for A.P. Statistics
This project reviews the data analysis unit for A.P. Statistics. Data collected from students will be their height and shoe size. The file includes the project description page to be handed to students along with a rubric. Included are the step-by-step Excel directions on analyzing the data and creating histograms. The project also includes an investigation on the correlation between height and shoe size. This portion of the project may work for Algebra 2 teachers wishing to review the least squ
Subjects:
Grades:
10th - 12th, Higher Education
Types:

Excel File for Baseball Simulator
For use with the Baseball Simulator Statistics Project
Subjects:
Grades:
9th - 12th
Types:

Scholastic Bowl Stat Tracker
(Free Resource) Spreadsheet top help track season progression and provide and end-of-season recap of player stats. May be used with one of the purchasable stat sheets, or independently.
Subjects:
Grades:
6th - 12th
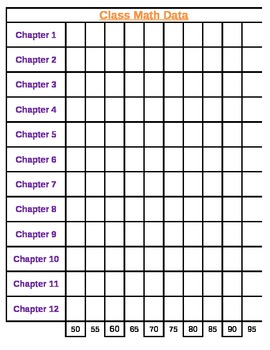
Math Class Data Sheet
Great for a class Data Wall!
This is an excel spreadsheet used to track yearly growth.
Enjoy!
Subjects:
Grades:
K - 12th
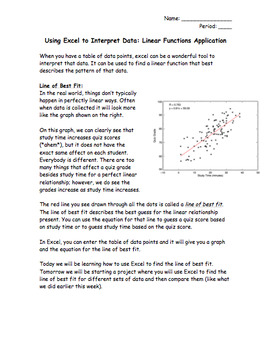
Excel Data Analysis Project
This mini Project covers the concepts of scatterplots and linear regression lines using data analysis in Excel. The project introduces the concepts of scatterplots and lines of best fit, has students work through a basic analysis of a data set using Excel, then has students complete a more complex analysis of a baseball data set. I created this for my standard 8th grade math class to cover CCSSM.8.SP.1, CCSSM.8.SP.3, MP.4, and MP.5 in an engaging and practical way. I had students working in pair
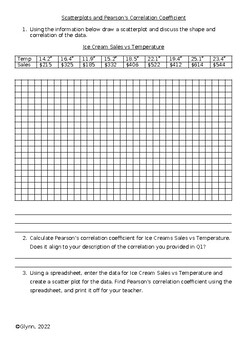
Scatterplots and Pearson's Correlation Activity
A quick activity to get students familiar with plotting scatterplots and using Pearson's correlation coefficient.
Subjects:
Grades:
10th - 11th
Types:
CCSS:
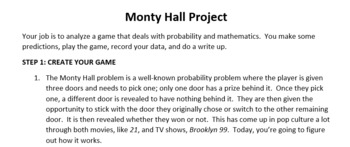
Monty Hall Project
Need a project to help your students with excel and probability? I've got you covered! Use this Monty Hall Project to help students make predictions, record data, and reflect on their process. Have students work individually or together and customize the project to your liking!
Subjects:
Grades:
7th - 12th
Types:
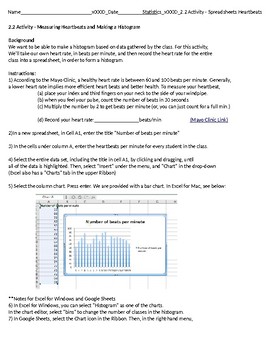
Statistics Unit 2 Activity - Spreadsheets and Heartbeats (1 day)
This is an activity where students are introduced to histograms and spreadsheets. Students will record their heartbeats/minute, then create a spreadsheet and use the data to make a histogram. It is intended as a 1-day walkthrough activity. This activity is compatible with Excel and Google Sheets. The Product includes: Excel spreadsheet with instructions and sampleProblems to solveTeacher instructions *The topics covered are spreadsheets and histograms, making and customizing a chart in spreadshe
Subjects:
Grades:
10th - 12th, Higher Education
Types:
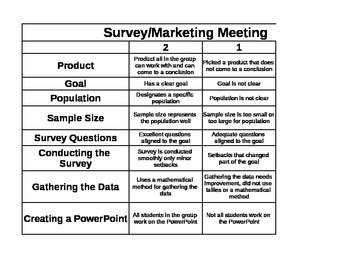
Survey/Marketing Meeting Rubric
This is a rubric I use for an end of unit project on statistics. Students work in groups, select a product they want to improve, create a survey, conduct the survey, analyze the data collected to market a new (improved) product. Students create a powere point or prezi to hold a marketing meeting for the class. Key Terms: sample size, population.
Subjects:
Grades:
6th - 9th
Types:

The Data Battle
A statistics-based whole class activity that requires students to make line graphs on Excel/Google Sheets and to make reasonable conclusions from the graphs. It is a fun and engaging way for students to have a bit of competition while learning.
Subjects:
Grades:
6th - 9th
Types:
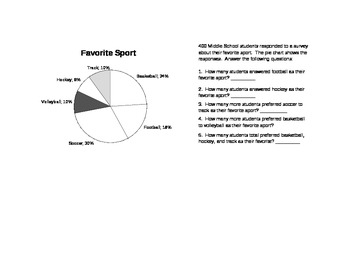
Pie Chart Practice
Printable Pie Charts from Microsoft Excel.
Have student evaluate the data in the chart and answer the provided questions.
Subjects:
Grades:
6th - 9th
Types:
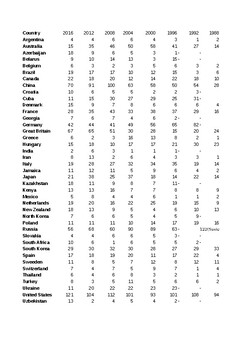
Olympic Medal Data for "Predicting Tokyo Olympics" Activity
This data is used for this product: Predicting Tokyo Olympics
Subjects:
Grades:
8th - 10th
Types:

Data Collection using TI-84 and Google Sheets
A great way to get students engaged in collecting data, using the TI-84, and using Google Sheets! TIP: I have the class record their data on a numbered sticky note and place them around the room for everyone to record on the paper. *You will need to make a copy so you can edit as you see fit for your class.
Subjects:
Grades:
10th - 12th
Types:

2-Day Flipped Classroom Lesson: Linear Regression
This 2-day lesson contains several java manipulatives and instructional videos from Khan Academy to help students in 9th grade
Algebra to understand the concepts behind linear regression, r values and r-squared values. You must develop your own in class activities but this document contains the "homework."
Subjects:
Grades:
8th - 9th
Types:
CCSS:
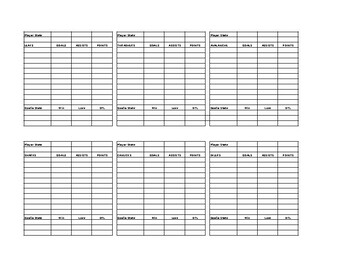
Intramural Hockey Stat Sheet
Hockey stats sheet for intramural floor hockey
Subjects:
Grades:
4th - 12th
Types:
Also included in: Intramural Hockey Package
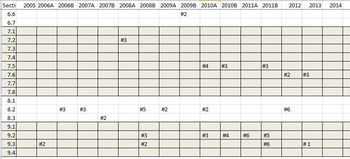
AP Statistics FRQs correlated to Peck Olsen Devore Textbook sections
I have taken all of the released FRQs from the college board (http://apcentral.collegeboard.com/apc/members/exam/exam_information/8357.html) and found the earliest point in which I can use them.
If you use the Peck, Olsen and Devore textbook, this source will let you start using FRQs early in the school year.
Subjects:
Grades:
11th - 12th
Types:
Showing 1-22 of 22 results


