306 results
9th grade Common Core 6.SP.B.5c resources
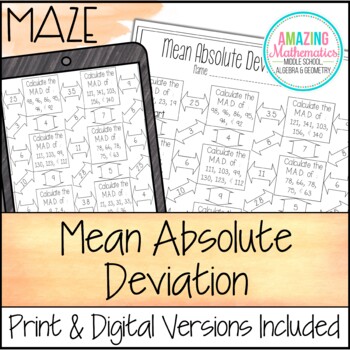
Mean Absolute Deviation Worksheet - Maze Activity
Printable PDF, Google Slides & Easel by TPT versions are included in this distance learning ready activity which consists of 11 mean absolute deviation problems. It is a self-checking worksheet that allows students to strengthen their skills at calculating mean absolute deviation. Digital Version also Available for 1:1 Classrooms--->>>Mean Absolute Deviation Maze - Digital 1:1 VersionImportant InformationNot all boxes are used in the maze to prevent students from just trying to fi
Subjects:
Grades:
6th - 9th
Types:
CCSS:
Also included in: 8th Grade Math Bundle ~ All My 8th Grade Math Products at 1 Low Price
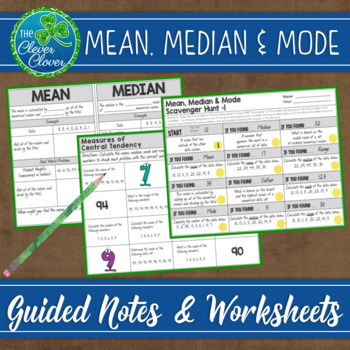
Measures of Central Tendency - Guided Notes, Worksheets and Scavenger Hunts
This resource includes guided notes, practice worksheets and two scavenger hunts on the measures of central tendency. Students will have a deep understanding of the averages, range and outliers after you implement this unit. Below you will find a detailed description of the guided notes, worksheets and the scavenger hunts.
Guided Notes
Four half pages of notes provide the definition and two practice problems for the mean, median and mode. Students will fill in key words and will calculate the
Subjects:
Grades:
6th - 9th
Also included in: Statistics Bundle - Guided Notes, Worksheets & Scavenger Hunts!
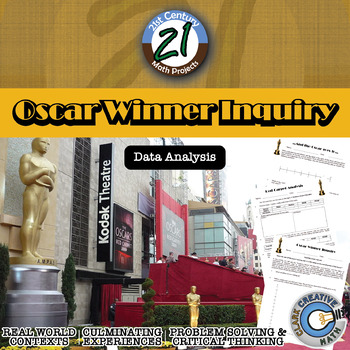
Oscar Winner -- Data Analysis & Statistics Inquiry - 21st Century Math Project
Utilize the last twenty years of Oscar winners as a data set to guide your students through creating box and whisker plots, histograms, and exploring mean, median, and mode -- in one 21st Century Math Project!Does the age of the award winning star in a film relate to the overall gross of the movie? Student will explore this inquiry question and use the data to support their conclusion.In this 8 page document you will be given a mapping to the Content Standards, an outline for how to implement t
Subjects:
Grades:
6th - 12th
Types:
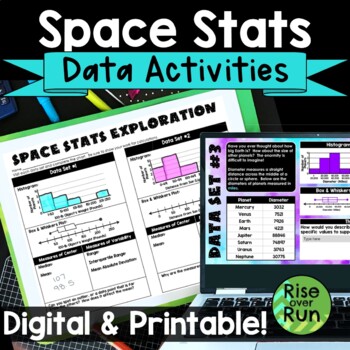
Box and Whiskers Plots and Histograms Activity with Real World Space Statistics
Use statistics for a real world application with this engaging activity about space stats! Students use real data to create histograms, box and whiskers plots, as well as calculate median, mean, range, interquartile range, and mean absolute deviation. This lesson works great for a space room transformation if you choose! Components are included in printable versions for in-person learning and Google Slides + Microsoft PowerPoint for online learning.Here’s what is included:Intro Presentation (Po
Subjects:
Grades:
6th - 9th
Types:
Also included in: Algebra 1 and 8th Grade Math Curriculum Bundle for Entire Year
Math Task Cards for Middle School and Algebra 1 Bundle
This bundle includes sets of task cards on the following Middle School Math or Algebra 1 content:5th GradeMultiply 2- and 3- Digit NumbersWriting Whole Numbers in Multiple Forms- Standard, Word, ExpandedWriting Numerical ExpressionsEvaluating Numerical Expressions/ Order of OperationsAdd DecimalsSubtract DecimalsUse Decimal Models to Multiply Decimals + Whole NumbersAdd+ Subtract FractionsMultiply Fractions (Whole + Mixed Numbers are included)Divide Fractions + Whole NumbersOrdered PairsCustomar
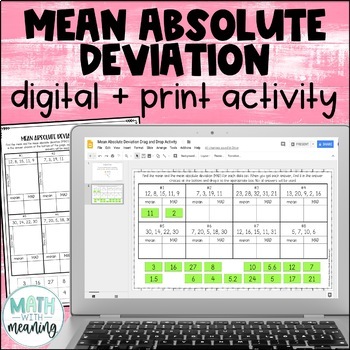
Mean Absolute Deviation MAD Digital and Print Activity for Google Drive
Looking for an engaging, no-prep activity to practice finding the MAD? Students will find the mean and mean absolute deviation for 8 data sets. They will then then find their answer from the answer choices at the bottom and drag it to the appropriate spot. Each data set contains 4-5 numbers. The mean of each data set is a whole number. Please view the preview file to make sure that these types of problems are appropriate for your students.This product includes the following:A link to the activit
Subjects:
Grades:
6th - 9th
CCSS:
Also included in: Middle School Math Digital and Print Activity Bundle Volume 2
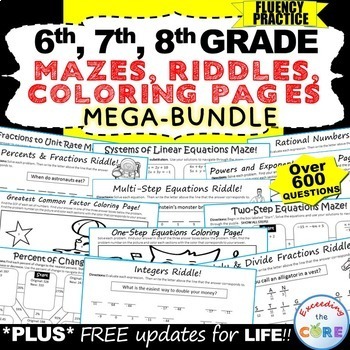
6th, 7th, 8th Grade Math MAZES, RIDDLES, COLORING Activities: end of year
This middle school math BUNDLE includes 49 sets (150 fun activities) of 6th, 7th, and 8th-grade MAZES, RIDDLES, AND COLORING BY NUMBER ACTIVITIES. All of these activities allow students to sharpen their math skills while incorporating fun into the classroom! An ANSWER KEY has been provided for all activities. Be sure to download the sample for a full overview of what you get.These resources are perfect for assessments, collaborative activities, end-of-year activities, and math stations. This i
Subjects:
Grades:
6th - 9th
Types:
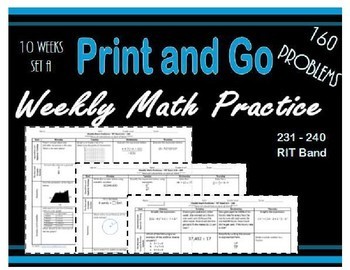
Daily Math Practice for RIT Band 231 - 240 Bundle
This set of math practice worksheets provides students with daily (Monday through Thursday) math problems based on the skills outlined in NWEA's Learning Continuum for MAP testing. Each day, students solve four problems, one problem per math goal. These practice problems are designed to provide students with a vast exposure to the 231 – 240 RIT Band skills and concepts that they are ready to develop. This resource can be used for a bell ringer, small group instruction, or homework. Each workshee
Subjects:
Grades:
6th - 9th
Types:
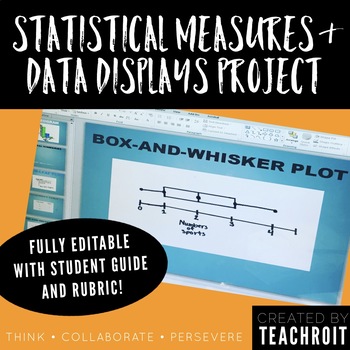
Statistics & Data Display Project for 6th Grade Math PBL (Fully Editable)
This product includes a student guide for a 6th grade middle school mathematics project that will require students to develop a statistical question, conduct a survey with their classmates, create numerical summaries, represent their findings using visual data displays, and finally present their findings! The thorough student guide provides step by step directions for each part of the project and could be used as either an in class project or to be assigned as homework. The student guide also in
Analyzing Plots, Graphs, and Tables using Measures of Central Tendency
This product provides students the opportunity to analyze data presented in different ways. By making calculations and analyzing data, students make conjectures and justify them using mathematical reasoning and evidence!What is included?This product contains 8 student work pages. Each work page contains a set of data displayed graphically with accompanying questions. The data displays included are 2 dot plots, 2 bar graphs, 2 frequency tables, and 2 stem-and-leaf plots. Students are required
Subjects:
Grades:
5th - 11th
Types:
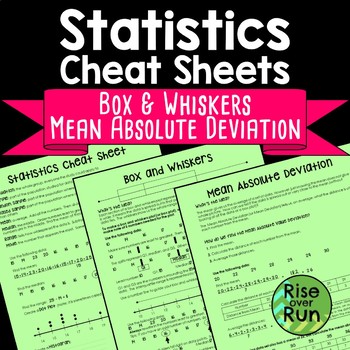
Box and Whiskers and Mean Absolute Deviation Cheat Sheets
Help students understand statistics vocabulary, dot plots, histograms, and box and whiskers diagrams, and mean absolute deviation with this resource.The three-page handout comes in two formats:Reference “Cheat Sheet” with all information filled in (pages 2-4)Guided Notes format with fill-in blanks and practice problems (pages 5-7)The first sheet defines important terms and helps students understand dot plots (or line plots) and histograms. The second sheet guides students in creating a box and w
Subjects:
Grades:
6th - 9th
Types:
CCSS:
Also included in: 7th Grade Math Activities, Lessons, Projects & More Bundle
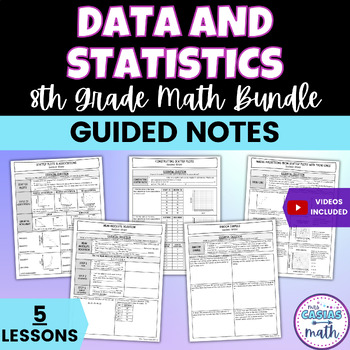
Data and Statistics Guided Notes Lessons BUNDLE 8th Math Pre-Algebra
This bundle includes 5 concise, to the point and no-prep data and statistics lessons. The lessons go over the basics of scatter plots, using trend lines on a scatter plots to make predictions, mean absolute deviation, and random samples. Students and teachers love how easy these notes are to follow and understand. This bundle includes some pre-lessons that will be necessary for students who may have missed instruction during the pandemic and need extra scaffolding. They could also work well with
Grades:
7th - 9th
CSI: Data Analysis & Probability Activity - Printable & Digital Review Game
Nothing like a good criminal investigation to liven up data analysis and probability! In this project, students will work in teams to investigate the culprit of six fictional thefts. The criminal has left six messages, layered with algebra. Teams will work to build a case and present their findings to the court. Hopefully they are convincing enough to win the verdict.The puzzle solving hook causes many different students to engage in solving traditionally mundane problems. Be the cool teacher :-
Subjects:
Grades:
6th - 12th
Types:
Also included in: Probability & Expected Value Unit Bundle - Distance Learning Compatible
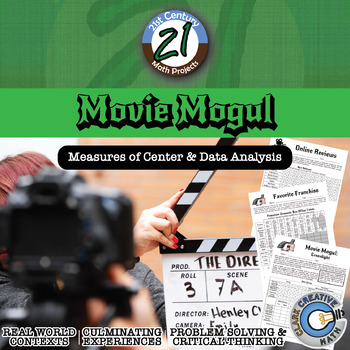
Movie Mogul - Mean, Median & Variation - Project - Distance Learning Compatible
Nowadays online reviews have a huge impact on business. Customer ratings help people decide what to buy and what products to avoid. Movies and entertainment are moving toward the world of intense data analysis of audience views to make business decisions. Companies like Amazon and Netflix have poured resources into developing original content. Let your students sit in the driver's seat! -- and practice Mean, Median and Variation in this 21st Century Math Project!In this 22 page document you will
Subjects:
Grades:
6th - 12th
Types:

6th, 7th, 8th Grade Math PROBLEM SOLVING GRAPHIC ORGANIZER BUNDLE : end of year
This middle school math BUNDLE includes 35 sets (350 problems) of 6th, 7th and 8th grade real-world COMMON CORE WORD PROBLEMS that students must solve and explain using problem-solving strategies. An ANSWER KEY has also been provided with examples of possible answers. Be sure to download the sample for a full overview of what you get.I created this problem-solving graphic organizer for my students who struggle solving WORD PROBLEMS and are unable to explain their work/solution. Each worksheet p
Subjects:
Grades:
6th - 10th
Types:
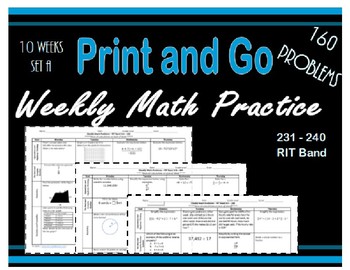
Daily Math Practice for RIT Band 231 - 240 Set A
This set of math practice worksheets provides students with daily (Monday through Thursday) math problems based on the skills outlined in NWEA's Learning Continuum for MAP testing. Each day, students solve four problems, one problem per math goal:
*Operations and Algebraic Thinking,
*Real and Complex Number Systems,
*Geometry, and
*Statistics and Probability.
These practice problems are designed to provide students with a vast exposure to the 231 – 2
Subjects:
Grades:
6th - 9th
Types:
Also included in: Daily Math Practice for RIT Band 231 - 240 Bundle
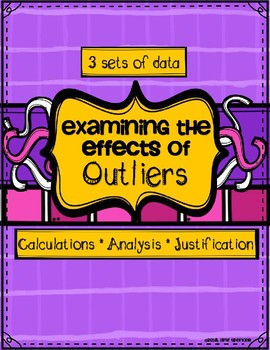
Examining Effects of Outliers on Measures of Central Tendency
This 10-page document contains 3 real-life data sets. For each data set, students are guided through an exploration of how outliers in data affect mean, median, mode, and range. Each data set requires students to perform calculations and analyze data. Students will make conjectures and justify them in writing using mathematical reasoning and evidence.
At the end of the activity, students are asked several concluding questions that require them to analyze and evaluate their work. They focus
Subjects:
Grades:
5th - 9th
Types:
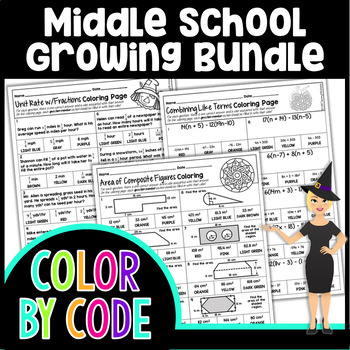
Middle School Math Color By Number Growing Bundle
This growing bundle of common core math color by number activities includes a wide range of topics from ratios & proportional relationships, the number system, expressions & equations, geometry, statistics & probability, and general math topics.What does a growing bundle mean?Purchasing this growing bundle means that you save 20% on all current resources in the bundle, any updates to the resources, and ALL future math color by numbers! Just check regularly in your "my purchases" for
Subjects:
Grades:
6th - 9th
Types:
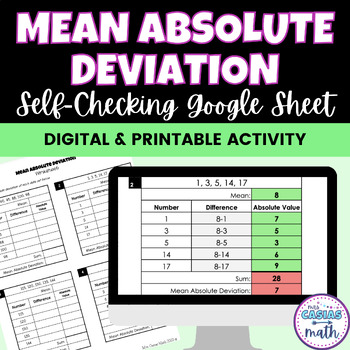
Mean Absolute Deviation Worksheet - Digital Self-Checking Activity & Printable
Students love the instant feedback of this self-checking mean absolute deviation activity! This activity checks the mean, absolute value distances between the mean & the data point, the sum of the absolute values, and the mean absolute deviation itself. The cells will turn green if the number is correct, and red if it is incorrect. It is great at catching student errors before the finish the entire process for these tedious mean absolute deviation problems!DIGITAL + PRINTABLE VERSIONSThere i
Subjects:
Grades:
6th - 9th
Types:
CCSS:
Also included in: Data and Statistics Digital Activities and Worksheets BUNDLE 8th Math
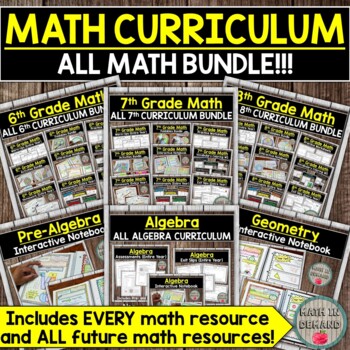
Entire Math Curriculum Bundle (All Math Resources)
⭐ This bundle includes ALL of my Math Curriculum in my Teachers Pay Teachers store ⭐You will be receiving ALL of my 6th, 7th, and 8th Grade Math interactive notebooks, activities, foldables, practice worksheets, warm-ups, exit slips, assessments, and much more! This is well over 1000 pages of material that I have created to help make math more enjoyable to students. My material also helps students to make connections to the real world.In addition to all of the math material in my store, you will
Subjects:
Grades:
5th - 10th
Types:
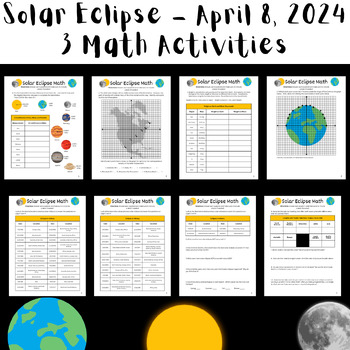
Solar Eclipse 2024 3 Math Worksheets - Middle School (Printable+Digital)
This activity contains 3 NO PREP middle school math activities (two are front-back and one is 4 pages) related to the Solar Eclipse happening April 8, 2024. Each activity can be used separately, completed as stations, or as a packet of worksheets. These activities were designed for middle school, but could be used for upper elementary (with scaffolding) or high school students in Pre-Algebra, Pre Algebra, Algebra, or Geometry. These activities includes the following math skills: Reflections o
Grades:
5th - 11th
Types:
NGSS:
MS-ESS1-2
, MS-ESS1-1
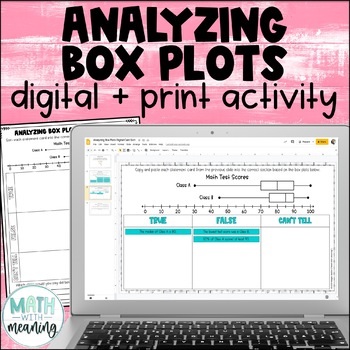
Box and Whisker Plot Digital and Print Card Sort - Reading and Analyzing
Looking for an engaging, no-prep activity to practice reading and analyzing box plots? Students will look at a double box plot and determine if statements about it are true, false, or if they can't tell from the information given in this fun digital and print activity.This activity includes statements about the minimum, maximum, median, quartile 1 (Q1), quartile 3 (Q3), interquartile range (IQR), and range of the box plots, along with statements about the percentages represented by a particular
Subjects:
Grades:
6th - 9th
Also included in: Middle School Math Digital and Print Activity Bundle Volume 3
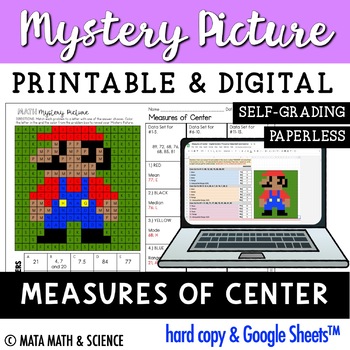
Measures of Center: Math Mystery Picture
About this resource:In this challenge, students solve 15 measures of center problems, finding the mean, median, mode, range and interquartile range (IQR) of three different data sets. Each correct answer will reveal a bit of the mystery picture. Students will be motivated to complete the math problems until all pixels are revealed!What's included?Printable Mystery PictureGoogle Sheets™ versionInteractive Notebook Cover SheetShow work templates (small and large boxes)Answer keyStandards alignment
Subjects:
Grades:
6th - 9th
Also included in: Every Single Math Mystery Picture: Growing MEGA BUNDLE for Middle School
Weighted Grades -- Middle and High School - 21st Century Math Project
We know all points are not created equal, but do your students? In my experience the answer is a CAPITAL "no". If you have a weighted grade system, you know how these conversations with your students and your parents go. Make the math teacher next door review weighted averages!In this 21st Century Math Project, you will be given a mapping to the Content Standards, an outline for how to implement the project, handout resources for students to use, and an answer key. ***THIS PRODUCT HAS BEEN UPDAT
Subjects:
Grades:
6th - 12th
Types:
Showing 1-24 of 306 results

