47 results
1st grade statistics resources for Microsoft Word
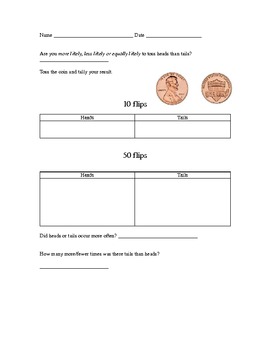
Probability: coin toss and dice roll
Teach probability using a penny and/or a dice. Introduce this probability game using key vocabulary: more likely, less likely or equally likely. Students will be able to practice using tally marks during the recording process.
Students will toss a penny 10 or 50 times and record the number of times heads or tails lands facing up. Students will roll a dice 10 or 50 times and record the number of times a even or odd number lands facing up.
Subjects:
Grades:
K - 4th
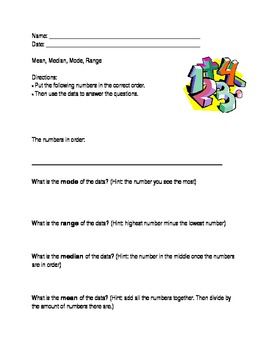
Mean, Median, Mode, Range; Modified Special Ed Math Template; Statistics
This is a modified worksheet from the middle school statistics curriculum. It is excellent for special education students who require an alternate or modified curriculum.
This worksheet allows teachers to input numbers in the blank space. This way teachers can use the template over and over with different numbers. Students are then to write the numbers in the correct order. Then, they have to find the mean, median, range, and mode. There are "hints" (formulas) that help the students differentia
Grades:
PreK - 12th
Types:
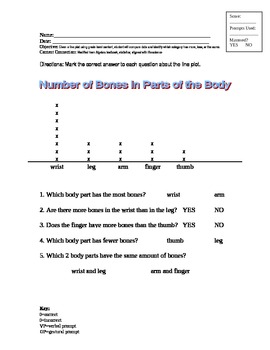
Reading a Line Plot; Modified Curriculum for Special Ed, Statistics
This line plot is modified from the middle school statistics curriculum. It is excellent for special education students who require an alternate or modified curriculum. The line plot is related to life science, and shows how many bones are in five different parts of the body. The questions on the worksheet ask questions about more and less. The answers are offered in a field of two.
This worksheet aligns with Maryland content standard:
Given a line plot using grade level content, student will c
Subjects:
Grades:
PreK - 5th
Types:
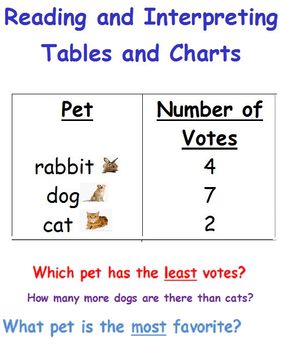
Reading a Table-Data and Statistics-First Grade
There are 4 different worksheets in which students can interpret the data of various tables. I hope they are of help to you! :)
Subjects:
Grades:
K - 3rd
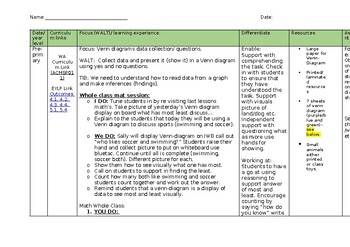
Venn Diagram lesson plan and resources
Lesson plan for teaching students how to use a Venn Diagram Pintables included for whole class and independent learning
Subjects:
Grades:
PreK - 6th
Types:
CCSS:

VicVELs Child Friendly Stats and Probability Footsteps Foundation to 6
Student friendly lists of VicVELs achievement standards for Statistics and Probability for Foundation to Level 6. These achievement standards are presented in a fun way for students and translated into child friendly language. Standards have also been broken into individual statements.
Subjects:
Grades:
PreK - 6th
Types:
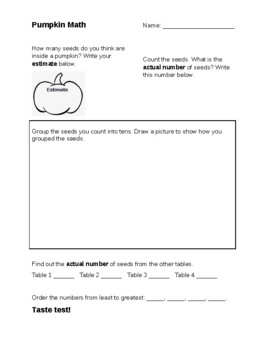
Pumpkin Math Activities
Pumpkin Math Lesson PlanIn this lesson, students will work in small groups with pumpkins in a variety of ways (scooping seeds, counting seeds, completing a taste test of cooked pumpkin seeds, and collecting and graphing data). It is an engaging way to help students meet a number of outcomes in Math and science. The worksheets attached to this lesson are editable to meet the needs of your classroom (e.g. number of pumpkins/tables in your room). They also provide a single place to record all of th
Subjects:
Grades:
1st - 5th
Types:
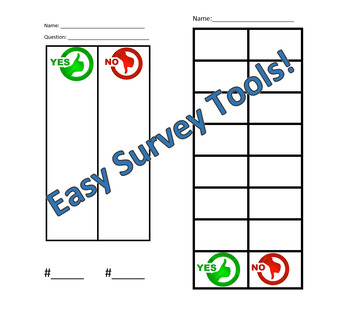
Easy Survey Tally Chart
Use this simple survey tally chart to help kids as young as 3 gather information. The chart is designed for yes or no questions.
Subjects:
Grades:
PreK - 1st
Types:
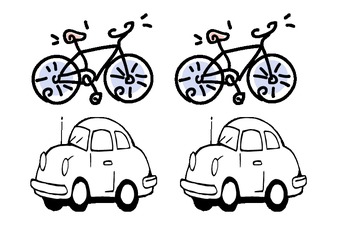
Picture Graph Pics - How the class travels to school
This is just a 4 page resource of pictures I used to introduce picture graphs to my year 1's.
There are four different pics - A bus, a car, a bike and someone walking.
I told the students that we were going to make a picture graph of how our class travels to school. We first made a tally table on the board and then students got the picture that matched their method of transport they take to school and got to colour it in. Once everyone had finished we made a big whole class picture graph.
A
Subjects:
Grades:
K - 2nd
Types:
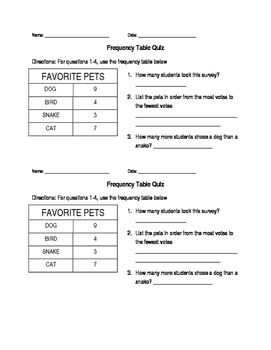
Math Frequency Table Quiz grades 1-3
This quiz is for students in grade 1, grade 2 and grade 3. The quiz has a frequency table on it and then it asks the students questions about the frequency table.
Subjects:
Grades:
1st - 3rd
Types:
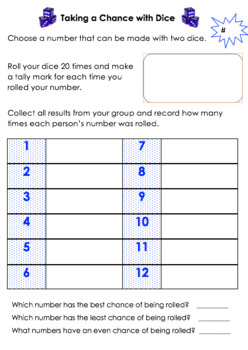
Taking a Chance with Dice
Students will work in a small group to play this simple dice game. Each group member selects a number from 2-12 and rolls the dice 20 times, recording a tally mark for each time their number is rolled. Student compare results and collate overall numbers rolled to find the chance of rolling numbers 2-12 with two die.
Subjects:
Grades:
1st - 4th
Types:
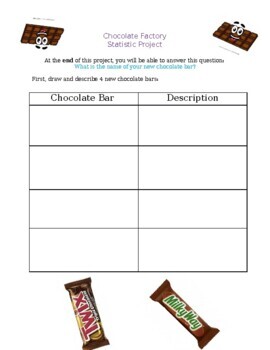
Chocolate Factory Statistics Project with Rubric
Chocolate Factory Statistics and Probability ProjectStudents are to come up with different chocolate bar designs and collect data on which is the most popular.At the end of the project, students can have a go at creating their chocolate bar packaging! Please see the store to see an additional, more comprehensive rubric.
Subjects:
Grades:
1st - 3rd
Types:
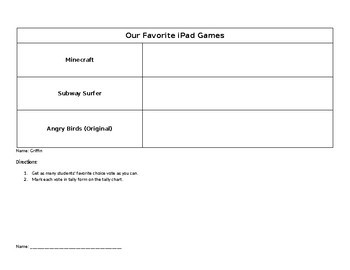
Tally Chart & Graph
My first graders loved doing this activity! Students get to pick their own category and choices then ask as many other students/people in the room as they can without double asking. Then they transfer their data to the the graph! This was a great, fun and engaging way to assess their learning during our data collection unit! Enjoy!
Subjects:
Grades:
1st - 2nd
Types:
CCSS:
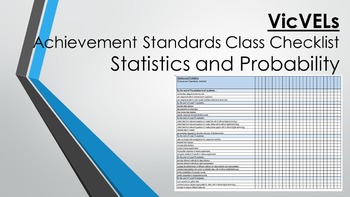
VicVELS Statistics and Probability Achievement Standards Class Checklist
VicVELs Achievement Standards for Statistics and Probability presented in a class checklist for primary levels, foundation to level 6. Great assessment tracker tool.
Subjects:
Grades:
PreK - 6th
Types:
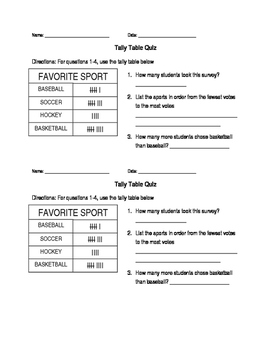
Math tally table quiz
This math tally table quiz can be used for 1st, 2nd or 3rd grade students. The quiz shows students a tally table and then asks them questions about the tally table.
Subjects:
Grades:
1st - 3rd
Types:
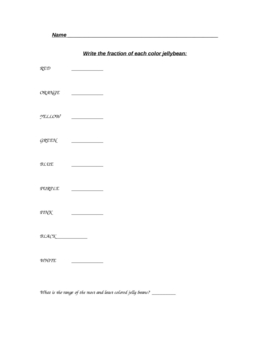
Easter Jelly Bean Fraction Math
Students are given a small bag of jelly beans. The find the fraction of each color and record it. Afterward, they find the range. Could be used in a math center.
Debbie Maldonado
Subjects:
Grades:
1st - 6th
Types:

Median, Mode, Range sheet
This sheet was designed for all students to record their estimation. This sheet is editable for you to add more blanks for your students if you have a bigger class. I would then close my eyes and randomly point to 5 student estimates and practice identifying the data with those five. At the end who ever was closest to the real number would then take home the jar next to be filled.
Subjects:
Grades:
1st - 5th
Types:
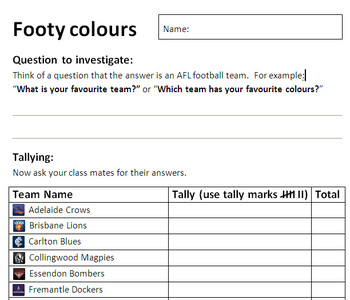
Graphing printable activity - Australian Rules Football teams
Students create questions about Australian Rules Football (AFL) football teams.
After designing their question, they ask their class mates and collect the answers in a tally. This information is then draw onto a bar/column graph.
I use this activity near the Grand Final on our Footy Colours Day at school. I've also created a Prometheam Interactive White Board flipchart to go with this. (Will need AvtivInspire software, or some way to import into your own IWB product)
This activity links in
Subjects:
Grades:
1st - 6th
Types:
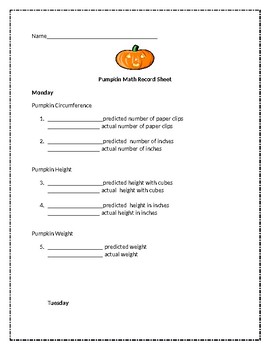
Pumpkin Math (Week Long Activities)
Throughout this fun filled week, children will explore:
-Circumference
-Weight
-Volume
- Distance
These are different hands on activities for each day of the week (Mon-Thurs)
Subjects:
Grades:
1st - 4th
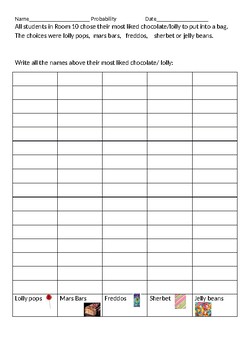
Grade 2/3 Chance Probability Activity
Students will collect data from the class, show the probability using fractions, drawings and a probability line as well as graph the results
Subjects:
Grades:
1st - 4th
Types:
Two Digit Math Problems With and Without Regrouping
This math worksheet will help your students stay organized and not be overwhelmed when doing math. There is 10 pages of math problems with 6 problems on a page that is in its own text box. This help students use the count up method of doing math by identifying the biggest number and making tally marks for the smaller number. One of my students who used this math worksheet say, "I can't believe it, I can do math!"
Subjects:
Grades:
K - 5th
Types:
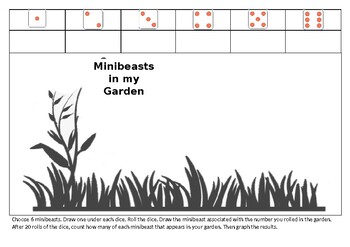
Minibeast Chance and data actitivity
Using the attached template, students work independently to collect and record data. This activity is suitable for Reception to Year 2. Choose 6 minibeasts. Draw one under each dice. Roll the dice. Draw the minibeast associated with the number you rolled in the garden. After 20 rolls of the dice, count how many of each minibeast that appears in your garden. Then graph the results.
Subjects:
Grades:
1st - 3rd
Types:
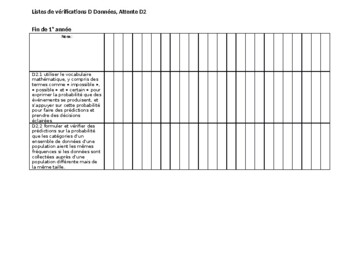
Tableau de curriculum de maths, Ontario 2020, Domaine D2
Voici le nouveau curriculum de maths, Domaine D2 (Données) sous forme de tableau Word, prêt à accepter les noms de vos élèves pour vous servir de liste de vérification ou évaluation. Vous pouvez également y mettre les mois de l'année afin de travailler votre planification à long terme! Toutes les attentes sont inclues, de la 1ère année à la 6ème, avec seulement de petits changements afin de faire rentrer toutes les attentes sur une seule page. Autres domaines disponibles!
Subjects:
Grades:
1st - 6th, Staff
Also included in: Tableaux de curriculum de maths, Ontario 2020
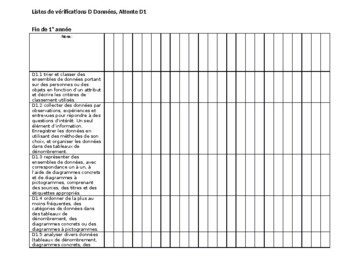
Tableau de curriculum de maths, Ontario 2020, Domaine D1
Voici le nouveau curriculum de maths, Domaine D1 (Données) sous forme de tableau Word, prêt à accepter les noms de vos élèves pour vous servir de liste de vérification ou évaluation. Vous pouvez également y mettre les mois de l'année afin de travailler votre planification à long terme! Toutes les attentes sont inclues, de la 1ère année à la 6ème, avec seulement de petits changements afin de faire rentrer toutes les attentes sur une seule page. Autres domaines disponibles!
Subjects:
Grades:
1st - 6th, Staff
Also included in: Tableaux de curriculum de maths, Ontario 2020
Showing 1-24 of 47 results


