Graphing and Data
Ashley Coston
0 Followers
Grade Levels
PreK - 3rd
Subjects
Resource Type
Standards
CCSS1.MD.C.4
CCSS2.MD.D.10
Formats Included
- PDF
Ashley Coston
0 Followers
Description
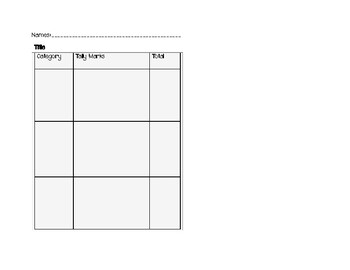
Students can complete their own surveys with tally charts, picture graphs and bar graphs.
Total Pages
Answer Key
N/A
Teaching Duration
N/A
Report this resource to TPT
Reported resources will be reviewed by our team. Report this resource to let us know if this resource violates TPT’s content guidelines.
Standards
to see state-specific standards (only available in the US).
CCSS1.MD.C.4
Organize, represent, and interpret data with up to three categories; ask and answer questions about the total number of data points, how many in each category, and how many more or less are in one category than in another.
CCSS2.MD.D.10
Draw a picture graph and a bar graph (with single-unit scale) to represent a data set with up to four categories. Solve simple put-together, take-apart, and compare problems using information presented in a bar graph.


