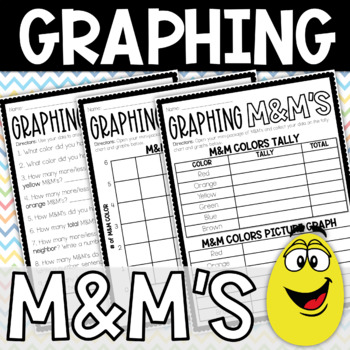
Graphing M&M's on Picture Graph and Bar Graph Activity
- PDF
What educators are saying
Also included in
- Halloween Math and Literacy Worksheets for 2nd Grade | October Review WorksheetsThis all-inclusive Halloween Worksheet Review Packet is the perfect review for the month of October. Inside, you will find an activity or worksheet for any subject area! Check out any of the worksheets and activities inPrice $9.99Original Price $50.00Save $40.01
Description
Graphing M&M's on Tally Chart, Picture Graph and Bar Graph Activity
This M&M Graphing Activity will keep your students engaged and excited about graphing. First, you will need to distribute a miniature (or standard) pack of M&M's to each of your students. Then, students will count up how many M&M's they have of each color in their pack. Next, students will tally how many M&M's they have of each color on the Tally Chart. Then, students will draw a picture graph of their M&M colors and record their data in a bar graph. Students will love counting up their M&M colors and graphing all of their data. Last, students will answer nine comprehension questions about the data they've counted up, tallied, and graphed. Enjoy!
Included
Page 1: Tally Chart and Picture Graph of M&M colors
Page 2: Bar Graph of M&M colors
Page 3: Comprehension Questions about data collected
♥♥♥Thank you for your purchase. Your feedback is greatly appreciated. For more products like this one, visit Last Minute Clicks by Kendra Crowley ♥♥♥


