
FUNCTIONS Word Problems - Error Analysis (Find the Error)


Exceeding the CORE
6k Followers
Grade Levels
7th - 10th
Subjects
Resource Type
Standards
CCSS8.F.A.1
CCSS8.F.A.2
CCSS8.F.A.3
CCSS8.F.B.4
CCSS8.F.B.5
Formats Included
- PDF
Pages
14 pages
Exceeding the CORE
6k Followers
What educators are saying
I teach at an IB school where students have to communicate their math understanding on a 1-8 scale. Error Analysis tasks are so crucial for the students to be able to find and discuss the problem.
Also included in
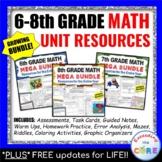 This is a Middle School MATH BUNDLE of 6 - 8 GRADE MATH Assessments, Warm-Ups, Task Cards, Error Analysis, Guided Notes, Classwork and Homework Practice Worksheets, Problem-Solving Graphic Organizers, Mazes, Riddles, Color by Number Pages. (201 Resources)This bundle includes 6-8th grade resources!!Price $534.49Original Price $763.55Save $229.06
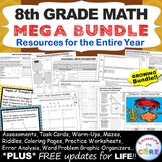 8th Grade Math COMMON CORE Assessments, Warm-Ups, Task Cards, Error Analysis, Homework Practice Worksheets, Problem Solving Graphic Organizers, Mazes, Riddles, Coloring ActivitiesThis is a GROWING BUNDLE of all of the 8th Grade MATH RESOURCES currently in my store { 52 Resources / OVER 560 PAGES }Price $140.17Original Price $200.25Save $60.08
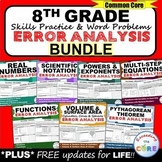 Great for online learning and distance learning!Have your students apply their understanding of math concepts with these 8th Grade ERROR ANALYSIS activities. This GROWING BUNDLE resource includes 7 sets (a total of 70 questions) of Common Core WORD PROBLEMS that are solved incorrectly. Students havPrice $20.00Original Price $27.65Save $7.65
 FUNCTIONS BUNDLE - Task Cards, Error Analysis, Graphic Organizers, Maze, Riddle, Coloring ActivityThis BUNDLE includes 40 Task Cards, 10 error analysis activities and 10 problem solving graphic organizers, 1 maze, 1 riddle, 1 coloring activity (over 90 skills practice and real-world word problems).Price $10.40Original Price $13.00Save $2.60
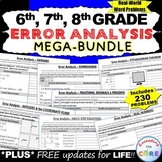 - Great for online learning and distance learning!This middle school ERROR ANALYSIS BUNDLE includes 230 real-world word problems (23 sets) that are solved incorrectly for grades 6-8. Students have to IDENTIFY THE ERROR, provide the CORRECT SOLUTION and share a helpful STRATEGY for solving the problePrice $65.00Original Price $90.85Save $25.85
Description
Have your students apply their understanding of FUNCTIONS with these ERROR ANALYSIS activities.
Benefits of Math Error Analysis:
Giving students opportunities to identify and correct errors in presented solutions allows them to show their understanding of the mathematical concepts you have taught.
Whats Included:
This resource includes 10 real-world FUNCTIONS word problems that are solved incorrectly. Students have to IDENTIFY THE ERROR, provide the CORRECT SOLUTION and share a helpful STRATEGY for solving the problem. An ANSWER KEY has also been provided with examples of possible answers. Be sure to download the sample for a full overview of what you get.
How to Use:
When I present this activity to my students, I tell them that these are errors that students from my other class made and I need their help to correct them. Students LOVE correcting other students mistakes. Students can use these activities with a partner, as a warm-up , as classwork, homework, in math centers or group work.
Be sure to download the sample for a full overview of what you get.
Topics Covered:
✔ Relations
✔ Functions
✔ Linear Functions
✔ Analyze & Compare Functions
Common Core Alignment :
* 8.F.1 Understand that a function is a rule that assigns to each input exactly one output. The graph of a function is the set of ordered pairs consisting of an input and the corresponding output.
* 8.F.2 Compare properties of two functions each represented in a different way (algebraically, graphically, numerically in tables, or by verbal descriptions)
* 8.F.3 Interpret the equation y = mx + b as defining a linear function, whose graph is a straight line; give examples of functions that are not linear.
* 8.F.4 Construct a function to model a linear relationship between two quantities. Determine the rate of change and initial value of the function from a description of a relationship or from two (x, y) values, including reading these from a table or from a graph. Interpret the rate of change and initial value of a linear function in terms of the situation it models, and in terms of its graph or a table of values.
* 8.F.5 Describe qualitatively the functional relationship between two quantities by analyzing a graph (e.g., where the function is increasing or decreasing, linear or nonlinear).
* MP3 - Construct viable arguments and critique the reasoning of others.
BUNDLE UP & SAVE $$ with my Functions UNIT RESOURCE BUNDLE
Get it all in my 8th Grade Common Core MEGA-BUNDLE!
More FUNCTIONS resources:
* Functions ERROR ANALYSIS
* Functions PROBLEM SOLVING GRAPHIC ORGANIZER
* Functions MAZE, RIDDLE, COLORING PAGE
More 8TH GRADE review:
* 8th Grade Daily/Weekly REVIEW
* 8th Grade ERROR ANALYSIS BUNDLE
* 8th Grade Winter MATH PACKET
* 8th Grade WORD PROBLEMS WITH GRAPHIC ORGANIZERS BUNDLE
If you would like to get updates on NEW and CURRENT resources...
FOLLOW the Exceeding the Core BLOG!
FOLLOW me on Teachers Pay Teachers!
FOLLOW me on Pinterest!
© Exceeding the CORE. All rights reserved. Please note - this resource is for use by one teacher only. Additional teachers must purchase their own license. Copying, editing, selling, redistributing, or posting any part of this product on the internet is strictly forbidden. Violations are subject to the penalties of the Digital Millennium Copyright Act.
Total Pages
14 pages
Answer Key
Included
Teaching Duration
45 minutes
Report this resource to TPT
Reported resources will be reviewed by our team. Report this resource to let us know if this resource violates TPT’s content guidelines.
Standards
to see state-specific standards (only available in the US).
CCSS8.F.A.1
Understand that a function is a rule that assigns to each input exactly one output. The graph of a function is the set of ordered pairs consisting of an input and the corresponding output.
CCSS8.F.A.2
Compare properties of two functions each represented in a different way (algebraically, graphically, numerically in tables, or by verbal descriptions). For example, given a linear function represented by a table of values and a linear function represented by an algebraic expression, determine which function has the greater rate of change.
CCSS8.F.A.3
Interpret the equation 𝘺 = 𝘮𝘹 + 𝘣 as defining a linear function, whose graph is a straight line; give examples of functions that are not linear. For example, the function 𝘈 = 𝑠² giving the area of a square as a function of its side length is not linear because its graph contains the points (1,1), (2,4) and (3,9), which are not on a straight line.
CCSS8.F.B.4
Construct a function to model a linear relationship between two quantities. Determine the rate of change and initial value of the function from a description of a relationship or from two (𝘹, 𝘺) values, including reading these from a table or from a graph. Interpret the rate of change and initial value of a linear function in terms of the situation it models, and in terms of its graph or a table of values.
CCSS8.F.B.5
Describe qualitatively the functional relationship between two quantities by analyzing a graph (e.g., where the function is increasing or decreasing, linear or nonlinear). Sketch a graph that exhibits the qualitative features of a function that has been described verbally.
Reviews
Questions & Answers
6k Followers
