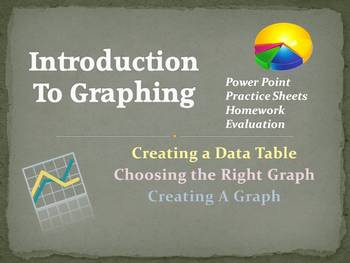
Data Tables and Graphing Introduction and Practice
Vicki - The Science Lady
681 Followers
Grade Levels
5th - 8th, Homeschool
Subjects
Resource Type
Formats Included
- Zip
Vicki - The Science Lady
681 Followers
What educators are saying
This was a great resource to help students get use to graphing and making tables in science! Thanks :)
Description
Students need practice creating data tables and graphs. Students also need to be able to interpret existing graphs. This lesson introduces students to data tables and graphs, teaches students how to create data tables from data, how to interpret tables and graphs, and offers hands-on opportunities to create data tables and graphs.
A 29-slide Power point presentation introduces data tables and graphing skills, offered in both 2003 and 2007 versions of Power point. Accompanying work pages in PDF format allow students to practice graphing skills. Suggested teaching ideas and all answer keys are provided.
Included in this download:
- Introduction to Graphing information sheet - PDF document
- Introduction to Graphing Power Point Presentation 2003 version (29 slides)
- Introduction to Graphing Power Point Presentation 2007 version (29 slides)
- Choose the Right Graph Practice Sheet and Answer Key (1 page)
- Interpreting Graphs - Student Work Page and Answer Key (3 pages)
- Graphing Practice - Student Work Page and Answer Key (4 pages)
- Graphing Activity - Open-ended, hands-on Student Activity and suggested answers (1 page)
- Data Tables and Graphs Evaluation - Student evaluation (1 page)
Topics covered:
-how data tables organize the data
-how data tables are created using proper column headings
-how to identify the independent and dependent variables
-how to choose the appropriate graph to best display the type of data that has been recorded - bar, line, and circle graphs are described
-how to create the graph from the data including choosing an axis scale
-how titles of data tables and graphs describe the activity and include the independent and dependent variables
-how the complete process works, from recording data to creating a graph, by using an example: George weighs his pet frog over a 2-week period
The materials included in this lesson can be completed in 2-3 class periods.
Total Pages
0 pages
Answer Key
Included
Teaching Duration
3 hours
Report this resource to TPT
Reported resources will be reviewed by our team. Report this resource to let us know if this resource violates TPT’s content guidelines.


