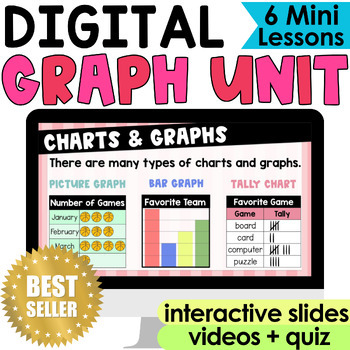
Data & Graphing, Picture & Bar Graphs Activities 2nd Grade Digital Google Slides
- Google Drive™ folder

What educators are saying
Also included in
- Measurement and data, oh my! Make it easy to teach measurement and geometry standards with this bundle of digital interactive math units on Google Slides- money, shapes, graphing, measurement, and time. Students will count coins, partition shapes, tell time to the 5 minutes, work with 2D and 3D shapPrice $39.50Original Price $67.00Save $27.50
- Simplify math instruction with these digital math units & google classroom math assignment bundle- money, shapes, graphing, time, addition and subtraction math facts, place value, and 2 digit addition and subtraction with regrouping. Engage your students with interactive activities. Use the GoogPrice $65.97Original Price $112.00Save $46.03
Description
Picture graphs, Bar Graphs, Tally Charts, OH MY! This digital graphing and data unit is full of interactive activities for 2.MD.10. Students create, read and analyze Pictographs, Bar Graphs, and tally charts. The Google Form graphing assessnent will make it easy to assess your students. This quiz is self-grading (yay!), PAPERLESS & NO PREP :)
Aligned to Common Core 2.MD.10 - Students will complete simple put-together, take-apart, and comparison word problems about the graphs.
Each bite-sized lesson is one document for easy assigning.
Includes:
> 6 Digital Graphing Lessons
- Intro to Data, Create and Read Tally Charts
- Read Picture Graphs
- Create Picture Graphs
- Read Bar Graphs
- Create Bar Graphs
- Collect and Represent Data on Picture Graphs and Bar Graphs
> Self-grading Shapes Quiz (Google Forms) - 5 questions
Most of this resource (including problem sets) are NOT editable. This is so students cannot alter the questions. You CAN delete slides or quiz questions.
How can I use this resource in my classroom?
- If you are 1:1 assign the slides as daily lessons
- Differentiate by assigning students slides based on their level
- Use on your interactive whiteboard for whole-class modeling
Need support?
theprimarydiary@gmail.com
Related Resources
>> DIGITAL TIME UNIT
⭐️ Follow me on TpT to be the first to see new resources!
Copyright © The Primary Diary
Permission for single classroom use only.


