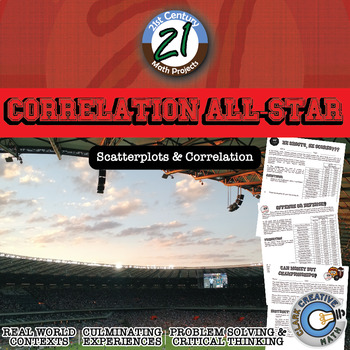
Correlation All-Star -- Sports Data Analysis - 21st Century Math Project
- Zip
- Google Apps™

What educators are saying
Also included in
- The project is the core of what I have built my classroom around. Scaffolding learners to real world projects. This bundle includes the 105+ math projects I have written. This is over 2,700 pages of content.21st Century Math Projects each scaffold through an authentic context and math skill buildingPrice $395.00Original Price $564.00Save $169.00
- This is a selection of my Correlations & Advanced Stats resources all in a money saving Essential Bundle! You save significant money and time versus purchasing these separately!Essential Bundles are designed to give you everything you need to rock your unit. Warmups, Notes, Activities, Games, ExPrice $18.00Original Price $32.00Save $14.00
- 12 of my best selling projects/units all in an organized money saving bundle! These engaging, student/teacher approved math projects that provide rigor, relevance, and cross-curricular content altogether. Check out the preview to see the alignment to the Common Core Standards! I have each of these pPrice $45.00Original Price $61.00Save $16.00
Description
Bring an authentic sports-based math project to your Algebra, Algebra 2 or PreCalculus classroom with Lines of Best Fit and Correlations! All in this 21st Century Math Project! Using data from the MLB, NBA, NFL and NHL students investigate correlations to some of sports most common questions like:
"Do more shots result in more goals?"
"Do hitters or pitchers have more impact on a team's wins?"
"What NFL stat is most strongly correlated with wins?"
and the grand-daddy...
"Can money buy championships?"
While students may dive into their favorite sport, they will be practicing rigorous topics Line of Best Fit (with slope and intercept) and correlation coefficients. TI-Graphing Calculator or Computer Lab with Excel required!
**NOTE -- this item now includes two version, one with older data, one with new. You have studnents see if there's been a change between the two version if you'd like**
In this product you will receive a 42 page PDF which includes:
3 different assignments, 1 project, graphs many data tables and an answer key. ***THIS PRODUCT HAS BEEN UPDATED WITH A GOOGLE SLIDES INTERACTIVE VERSION INCLUDED. REDOWNLOAD IF YOU HAVE IT ALREADY***
- In “He Shoots, He Scores!!!” students will construct scatterplots and draw lines of best fit. While using NHL shot and goal data.
- In “Offense or Defense” students will use TI Graphing Calculates to create scatterplots and determine lines of best fit and correlation coefficients using Runs Scored and Runs Allowed MLB data.
- In “Gridiron Challenge” students will look at NFL data to determine which statistics has the strongest correlation with winning.
-- AND FINALLY in “Can Money Buy Championships?” students will look at data from the four major American sports leagues to answer this inquiry question.
You may be interested in the following discounted bundles. SAVE $$$!
•Correlations & Advanced Stats
•21st Century Math Projects -- All the Projects
•Algebra 2 - Pre-Calculus Projects Starter Bundle
Need an Entire Curriculum?
•21st Century Algebra 2 / Pre-Calculus –- the Entire Curriculum
For more tips, tricks and ideas check out the Clark Creative Education Blog
And join our community where I post ideas, anecdotes, elaborations & every once in a while I pass out TPT gift cards! And jokes! I do jokes too!


