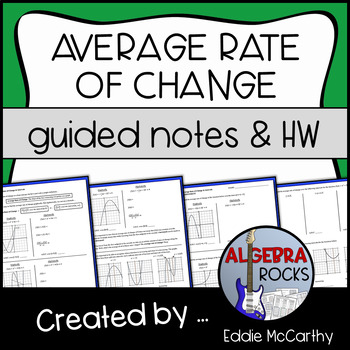
Average Rate of Change and Intervals - Guided Notes and Homework
Eddie McCarthy
1.2k Followers
Grade Levels
7th - 12th, Homeschool
Subjects
Resource Type
Standards
CCSSHSF-IF.B.4
CCSSHSF-IF.B.6
Formats Included
- Zip
Pages
4 pages
Eddie McCarthy
1.2k Followers
Description
This lesson is part of my Quadratic Functions Unit
This lesson includes 2 pages of guided notes and a 2 page assignment.
Students learn about average rate of change in the order below. They will:
- Learn its basic definition (slope between two points on a graph)
- Learn and understand its formula
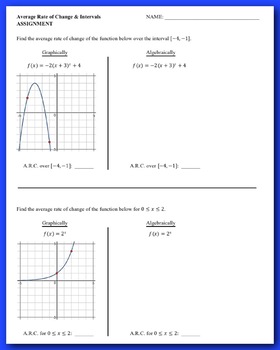
- Find the average rate of change for 3 different functions graphically and algebraically
- Understand that an average rate of change of 0 does not mean the function was constant over the interval
- Indicate increasing and decreasing intervals from provided graphs
Answer key is included!
Total Pages
4 pages
Answer Key
Included
Teaching Duration
1 hour
Report this resource to TPT
Reported resources will be reviewed by our team. Report this resource to let us know if this resource violates TPT’s content guidelines.
Standards
to see state-specific standards (only available in the US).
CCSSHSF-IF.B.4
For a function that models a relationship between two quantities, interpret key features of graphs and tables in terms of the quantities, and sketch graphs showing key features given a verbal description of the relationship.
CCSSHSF-IF.B.6
Calculate and interpret the average rate of change of a function (presented symbolically or as a table) over a specified interval. Estimate the rate of change from a graph.


