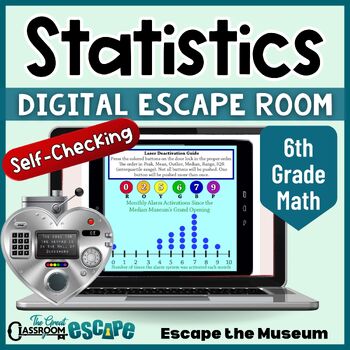
6th Grade Math Data Analysis & Statistics Activity Digital Escape Room Game
- PDF
- Google Apps™
- Easel Activity

What educators are saying
Also included in
- Give students a fun and engaging way to practice and review 6th grade math skills with these challenging digital escape rooms! All of these activities are self-checking, little to no prep, and fully automated by Google Forms™. They can be used by anyone with an internet connected device (you do NOTPrice $64.31Original Price $80.39Save $16.08
Description
Find the median, read the box plot, interpret the frequency table, and unlock the door! This 6th grade math activity based on statistics and probability standards will put your students statistical skills to the test. Your students are volunteer docents at the Median Museum. After the security system locks everyone in, they will need to use their knowledge of statistics to escape the museum. This engaging digital escape room is easy for teachers to implement. The breakout process is fully automated by a Google Form™ (does not require Google Drive™ or e-mail addresses). There is one page that needs to be printed for each group of students that will get them started on this statistics escape.
Escape rooms are a great way to increase student engagement and collaboration while reviewing and reinforcing important skills. This standards based escape room covers many sixth grade statistics and probability standards. You can use this activity with a substitute, to review for end-of-year testing, to provide enrichment, or just for fun!
In order to solve the puzzles in this digital breakout, students must be able to:
- Read and interpret dot plots, box plots, histograms, and frequency tables
- Calculate the mean, median, range, and IQR (interquartile range) of a data set
- Interpret quartiles
- Given the mean, students must be able to find the value of a missing data point
- Decide whether or not a question is a statistical question or not
- Solve basic logic puzzles
What's included in the PDF?
- Quickstart guide
- Detailed instructions & tips
- One clue that needs to be printed for each group working on the breakout. This clue includes the backstory and a QR code to access the Google Form™.
- URL to access the Google Form™.
- Detailed answer key
- Success signs to snap photos with after completing the activity (optional)
- Optional link for Google Drive™ users to create a copy of the form to save to their own drives in order to view student results.
FAQ
- Do students need to have Gmail™ accounts? NO! Anyone with internet access and a tablet, computer, or even phone can complete the breakout.
- How long will this take? That is the hardest question as the answer varies depending on each classroom, student, or group. Most students will be able to complete this activity in under 45 minutes. You can allow 60 minutes to be safe. The form will not save student data, so if you are worried about your students not finishing on time, simply have them write their answers on scratch paper. They can then come back and quickly re-enter their answers and pick up where they left off. Some students with a firm grasp on the concepts covered in this escape room will be able to complete the puzzles very quickly (20-30 minutes), others will take longer.
- Will students have to search the web to figure out the puzzles? NO! All of the information needed will be provided in the Google Form™. The math in this activity is all standards-based.
This activity has been updated with instructions and tools for distance learning implementation. You can use this online breakout for remote teaching and homeschooling as a fun worksheet alternative.
View all of our digital breakouts for 6th grade math standards


